| StockFetcher Forums · General Discussion · Still Waiting | << 1 2 3 >>Post Follow-up |
| shillllihs 6,102 posts msg #158550 - Ignore shillllihs modified |
2/8/2022 8:25:13 PM Sorry, what I meant to say is can the prior days bar change, I could have sworn they did on Tradingview. Tqqq had a Green Day yet the candle is Red. So is Tqqq a short in your book? This takes 2 days bars into consideration right? I’m on vacation and haven’t studied them much. |
| push5280 202 posts msg #158552 - Ignore push5280 |
2/8/2022 8:58:28 PM wantonellis...... here is a good video and explanation of using using HA with a smoothing technique. as the trend wanes the candles get narrower. I thing there are a few folks on TradingView who have the code and use it. https://www.youtube.com/watch?v=AivXfzhzs84 |
| Mactheriverrat 3,178 posts msg #158553 - Ignore Mactheriverrat |
2/8/2022 10:08:31 PM @shillllihs To me TQQQ is Bearish until it has a sustained move above the Orange downtrend line. IMHO. 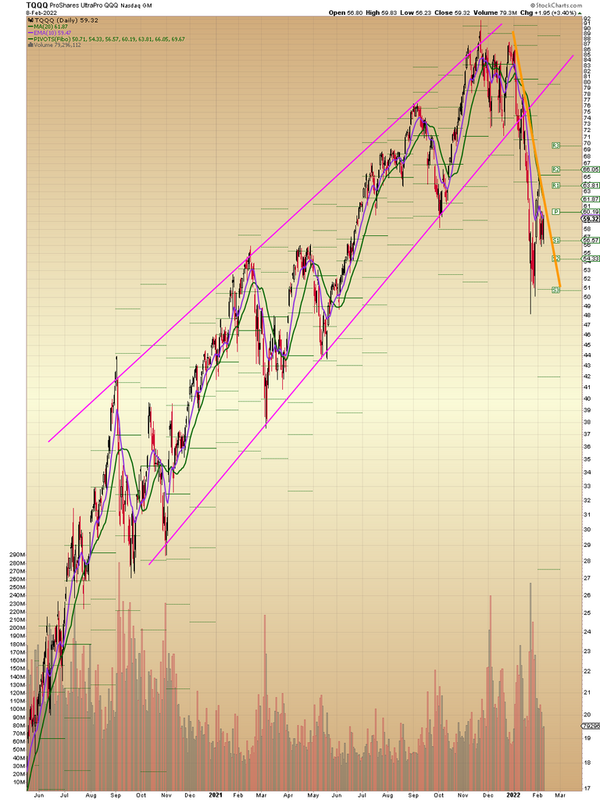 |
| wantonellis 168 posts msg #158556 - Ignore wantonellis |
2/9/2022 6:49:04 AM Sorry, what I meant to say is can the prior days bar change, I could have sworn they did on Tradingview. Tqqq had a Green Day yet the candle is Red. So is Tqqq a short in your book? This takes 2 days bars into consideration right? I’m on vacation and haven’t studied them much. Based on the HA formula the prior day bar shouldn't change. At the end of the day the daily HA is set. At the end of the week the weekly HA is set and so on. Yes two bars to calculate. The Heikin-Ashi Formula Normal candlestick charts are composed of a series of open-high-low-close (OHLC) candles set apart by a time series. The Heikin-Ashi technique shares some characteristics with standard candlestick charts but uses a modified formula of close-open-high-low (COHL): Here's the formula - https://www.investopedia.com/trading/heikin-ashi-better-candlestick/ Looks like TQQQ is currently red on the monthly, weekly and daily HA charts. |
| wantonellis 168 posts msg #158557 - Ignore wantonellis |
2/9/2022 6:49:58 AM wantonellis...... here is a good video and explanation of using using HA with a smoothing technique. as the trend wanes the candles get narrower. I thing there are a few folks on TradingView who have the code and use it. https://www.youtube.com/watch?v=AivXfzhzs84 Thanks I'll check it out. |
| fotchstecker 314 posts msg #158604 - Ignore fotchstecker modified |
2/17/2022 6:46:21 PM I have tested HA systems at length. You need another filter besides the system. HA works well in trends. But then, if you have a good filter for trends, you don't need HA. If you take a cross section of the market, you'll find that the outperforming HA tickers are also just generally the outerpforming tickers. So HA alone I'm afraid is not your answer. In a sideways market, by the close and painting of the bar, you will be whipsawed and chopped to pieces with an HA system. I've testing this on 1min to 1week data on a bunch of uncorrelated stocks. I've tested HA of a few varieties, including smoothed, and long, short, and long+short. I've tested with exits based on HA color change and on other stops. |
| shillllihs 6,102 posts msg #158605 - Ignore shillllihs |
2/17/2022 6:59:09 PM Can someone do a backtest on SPY since 2000 using the MONTHLY for HA? Only place I’ve seen monthly is TradingView…Thanx. |
| fotchstecker 314 posts msg #158606 - Ignore fotchstecker |
2/17/2022 7:32:29 PM Long, short, or L+S? |
| fotchstecker 314 posts msg #158607 - Ignore fotchstecker modified |
2/17/2022 7:49:15 PM This is a long-short HA system of SPY since around march 2000 using monthly data and 100 shares per trade where the buy is on the close of the bar. https://imgur.com/a/M1FQj81 I don't know how to post a link. The (not SF) code for my version. if BarNumber = 1 then begin haOpen = open; haClose = (O+H+L+C)/4; haHigh = MaxList( high, haOpen, haClose); haLow = MinList( low, haOpen,haClose); end; if BarNumber > 1 then begin haClose = (O+H+L+C)/4; ////average bar price haOpen = (haOpen [1] + haClose [1])/2 ; ////avg open/close 1 bar ago haHigh = MaxList(High, haOpen, haClose) ; ////highest of high,open,close haLow = MinList(Low, haOpen, haClose) ; //// lowest of low, open, close if haClose > haOpen then color = UpColor else color = DnColor; End; [https://imgur.com/a/M1FQj81] |
| shillllihs 6,102 posts msg #158608 - Ignore shillllihs |
2/17/2022 10:05:41 PM Awesome thank you. Can you run the buy at monthly close system using regular daily candles. I really would like to compare the 2. Can you include drawdowns on both unless I missed it, thanx. https://www.newtraderu.com/2021/01/16/200-day-moving-average-strategy-that-beats-buy-and-hold/ |
| StockFetcher Forums · General Discussion · Still Waiting | << 1 2 3 >>Post Follow-up |