StockFetcher Forums · Stock Picks and Trading · Flat Patterns<< 1 ... 3 4 5 6 7 >>Post Follow-up
Nobody
404 posts
msg #155752
Ignore Nobody
2/14/2021 12:49:28 AM
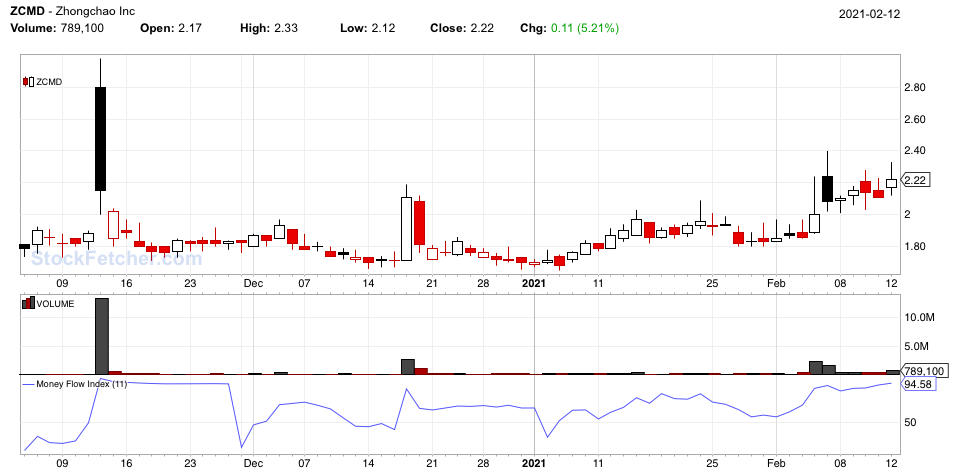


Nobody
404 posts
msg #155753
Ignore Nobody
2/14/2021 12:51:44 AM
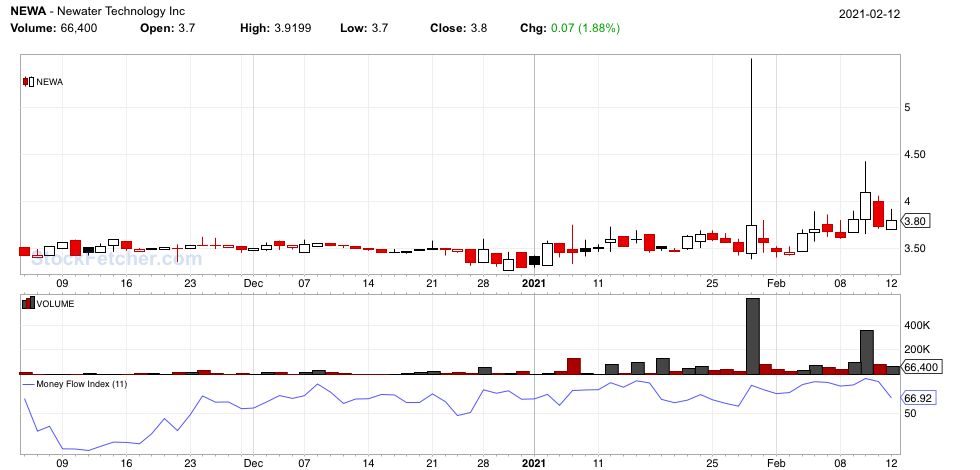


Nobody
404 posts
msg #155804
Ignore Nobody
2/15/2021 3:43:02 PM
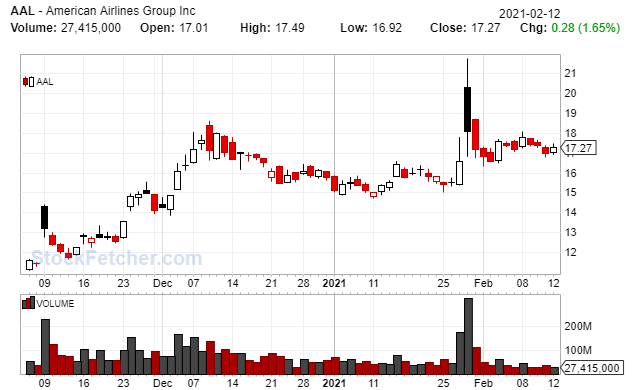


graftonian
1,089 posts
msg #155833
Ignore graftonian
2/16/2021 7:16:25 PM

Another way to detect a sleeper.

Fetcher[
/* MACD cross-over FEB16 */
optionable
close > MA(200)
volume > Average Volume(30)
Average Volume(30) > 2000000
MACD Fast Line(12,26,9) crossed above MACD Slow Line(12,26,9)
/* strength of MACD cross */
set{FastSlope, slope of MACD Fast Line(12,26,9)}
set{SlowSlope, slope of MACD Slow Line(12,26,9)}
set{CrossingAngle, FastSlope / SlowSlope}
add column CrossingAngle and sort on column 5 descending
date offset is 30 days
]


Nobody
404 posts
msg #155844
Ignore Nobody
2/17/2021 4:29:08 PM

Thank you Graftonian


Nobody
404 posts
msg #155845
Ignore Nobody
2/17/2021 4:30:53 PM

Graf
From your filter

this looks interesting to me
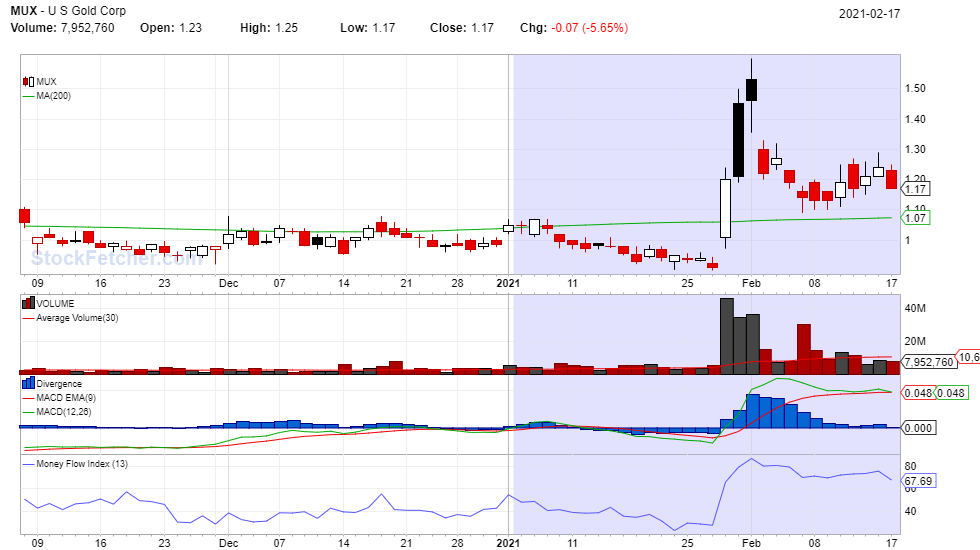


SAFeTRADE
630 posts
msg #155846
Ignore SAFeTRADE
2/17/2021 5:05:56 PM

Here is another look at slope of MACD(12,26,9)

Fetcher[
set{fast_slope, crsi(macd(12,26,9) fast line,3))}
dow 30
set{f45buy, count(fast_slope crossed above 50,1)}
set{f45sell, count(fast_slope crossed below 89,1)}
draw macd(12,26,9)
draw fast_slope line at 90
draw fast_slope line at 50
draw f45buy
draw f45sell
draw Slow Stochastics Fast %K(13)
draw macd(3,8,5)
]


graftonian
1,089 posts
msg #155849
Ignore graftonian
2/17/2021 8:15:31 PM

Yet another way to detect early stirrings. My question to you is how to trade this mess. My 1st thoughts are to wait till the following day. Any gain in extended or reg hours is good enough for me, However, if one is confronted with a red candle, wait. It will either turn around or offer a better entry price, Next day, same deal. At this point, the trade probably off and I'll start looking for a pivot low.
God it's cold, I haven't been out of the house in 5 days. They're trying to kill this ex-California guy.
Graf

Fetcher[
/************************* SLEEPING DOGS ************************/
/** Looking for A sudden increase in ADR in a flatline. Feb10 **/
/* VolFlag add Feb14 */
/* RangeX added Feb17 */
/* indented lines are filters */
optionable
close between .50 and 30
close > MA(200)
slope of MA(200) > 0
draw Average Volume(30) > 1234567
set{Range1, high - low}
set{Range, Range1 / close}
set{AvgRng2, cma(range, 2)}
draw AvgRng2
set{AvgRng100, cma(range, 100)}
draw AvgRng100 on plot AvgRng2
set{RangeX, Range / AvgRng100}
RangeX > 1.5
draw RangeX and draw RangeX line at 1
/*****/
set{ADRflag, count(AvgRng2 crossed above avgRng100, 1)}
draw ADRflag
ADRflag equals 1
set{VolFlag, count(volume > Average Volume(30), 1)}
draw VolFlag
VolFlag equals 1
add column separator
add column Range
add column AvgRng100
add column RangeX
/*** sort ***/
sort on column 8 descending
/** filter out results from negative moves **/
set{AvgHL1, high + low}
set{AvgHL, AvgHL1 / 2}
AvgHL > AvgHL 1 day ago
do not draw AvgHL
]


Nobody
404 posts
msg #155854
Ignore Nobody
2/18/2021 10:10:26 AM

SAFeTrade

Found this on your filter -- thank you. What you think
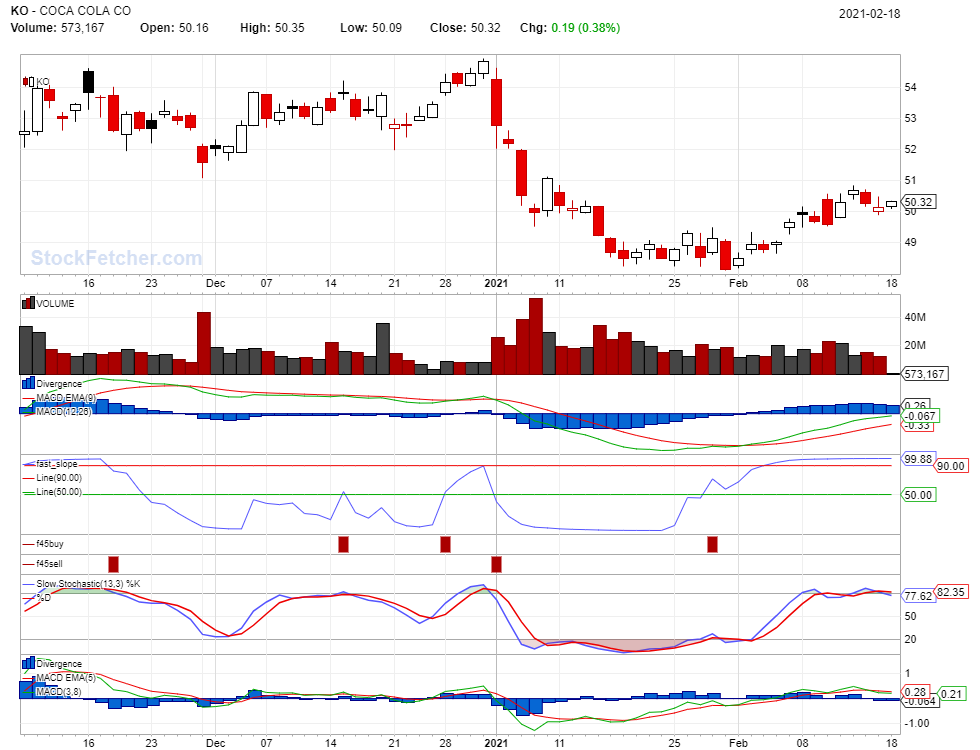


graftonian
1,089 posts
msg #155855
Ignore graftonian
2/18/2021 12:04:12 PM

Nobody,
My 2 cents worth re: KO. If you consider 49.88 as a pivot low, a close above 50.88 and a hike in volume would have my interest.
Graf

StockFetcher Forums · Stock Picks and Trading · Flat Patterns<< 1 ... 3 4 5 6 7 >>Post Follow-up

*** Disclaimer *** StockFetcher.com does not endorse or suggest any of the securities which are returned in any of the searches or filters. They are provided purely for informational and research purposes. StockFetcher.com does not recommend particular securities. StockFetcher.com, Vestyl Software, L.L.C. and involved content providers shall not be liable for any errors or delays in the content, or for any actions taken based on the content.


Copyright 2022 - Vestyl Software L.L.C.Terms of Service | License | Questions or comments? Contact Us
EOD Data sources: DDFPlus & CSI Data Quotes delayed during active market hours. Delay times are at least 15 mins for NASDAQ, 20 mins for NYSE and Amex. Delayed intraday data provided by DDFPlus


This site is protected by reCAPTCHA and the Google Privacy Policy and Terms of Service apply.