| StockFetcher Forums · Stock Picks and Trading · Generic2 | << 1 2 3 4 5 ... 14 >>Post Follow-up |
| four 5,087 posts msg #130500 - Ignore four modified |
8/19/2016 11:45:53 PM I don't trade 3x ETFs, 2x etc... This filter found them but I wouldn't enter a trade [ignore filter]. 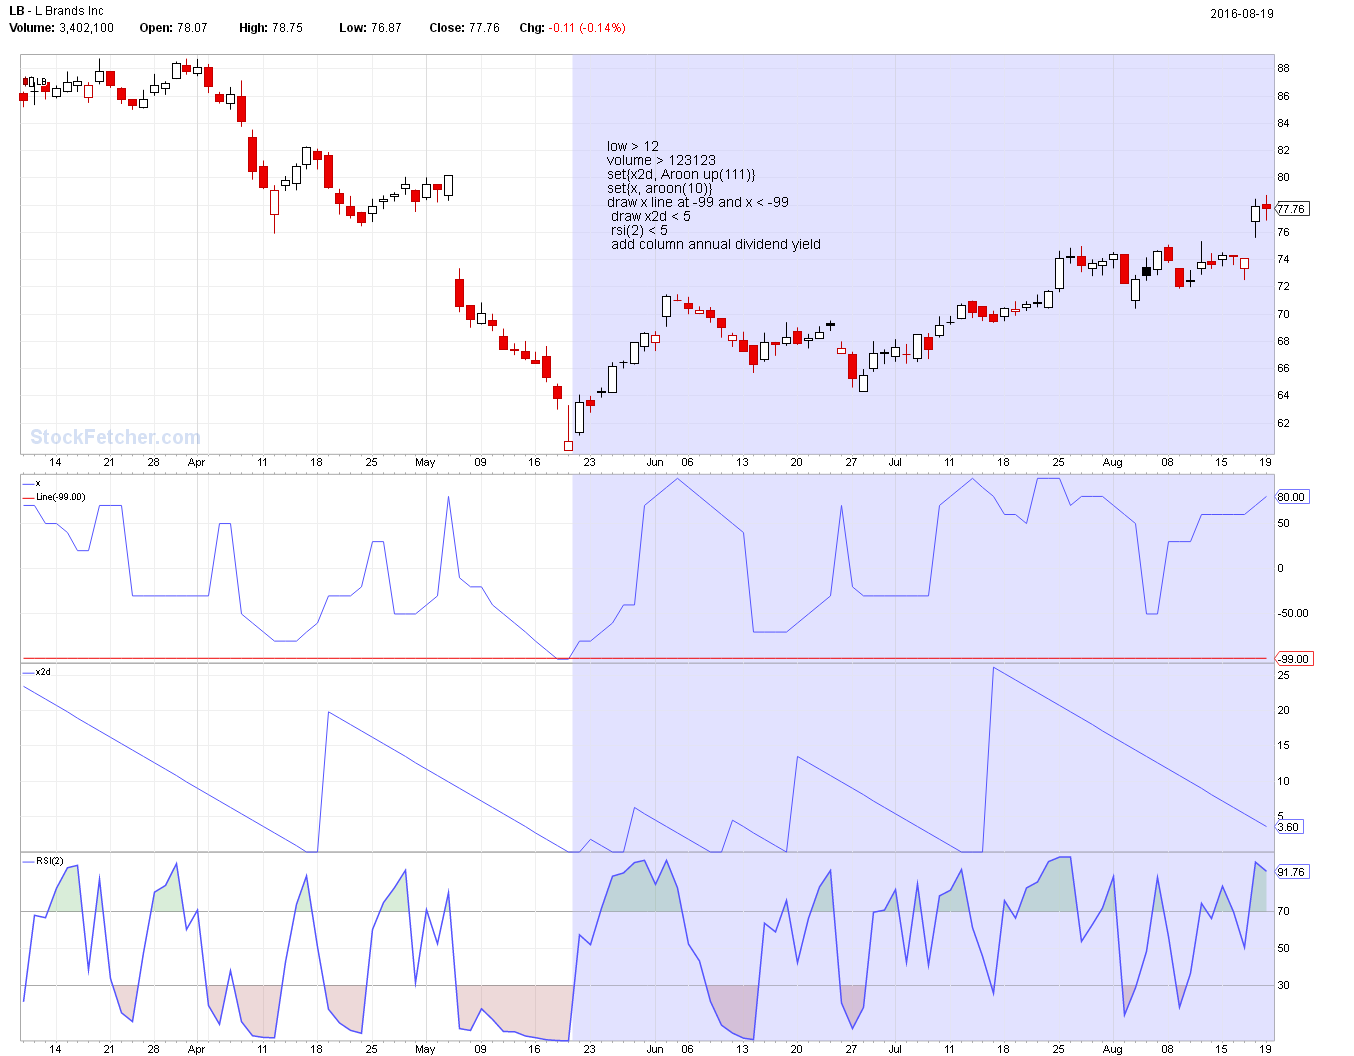 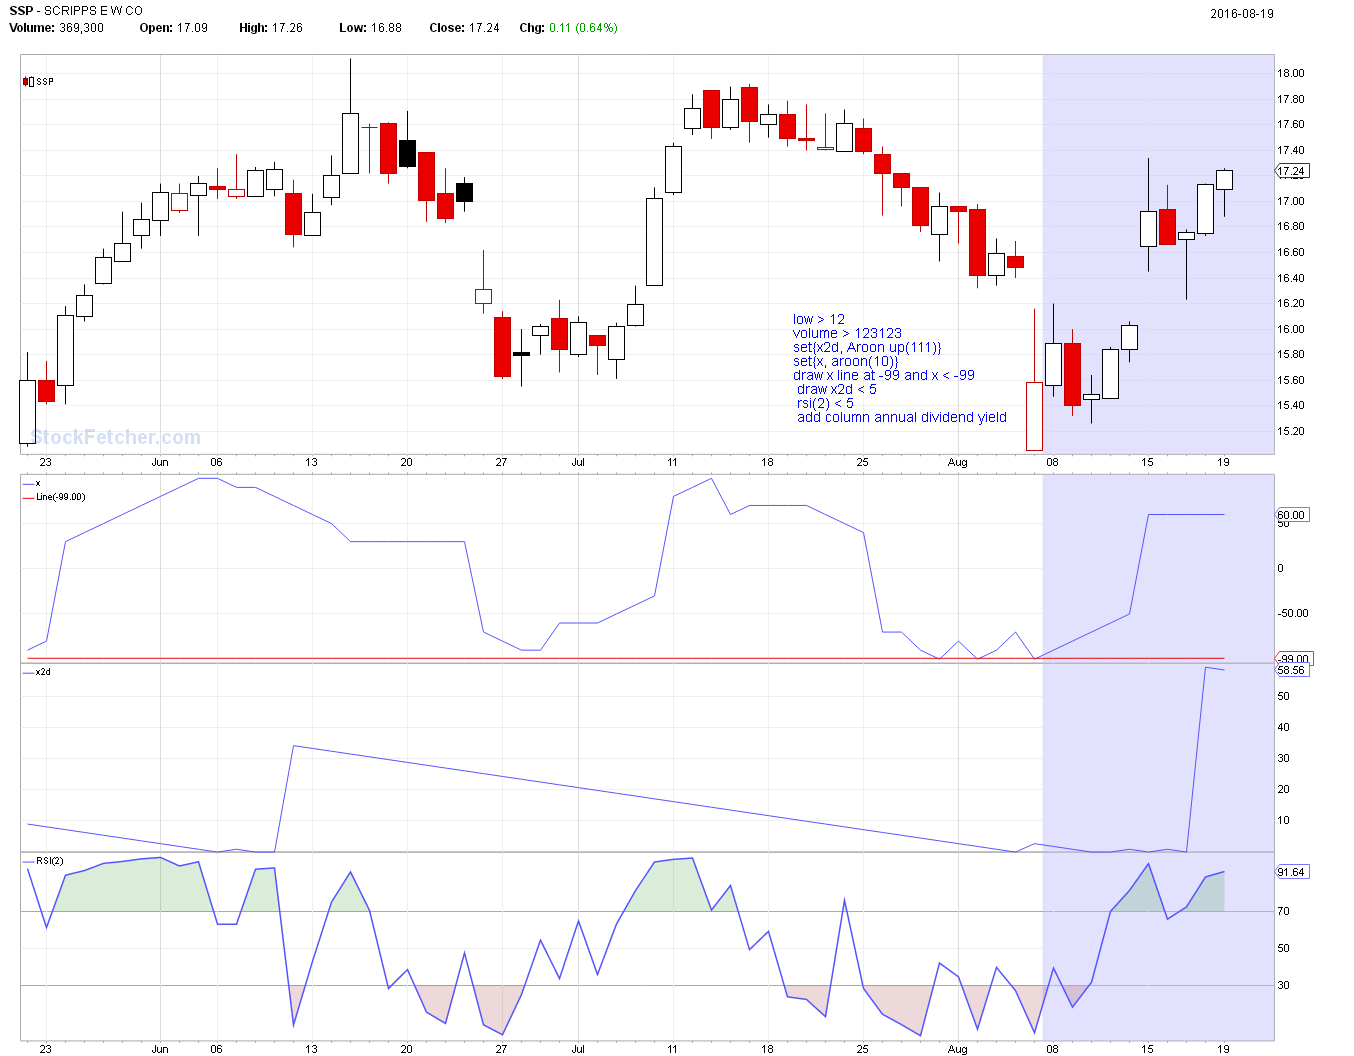 --OPTION-- 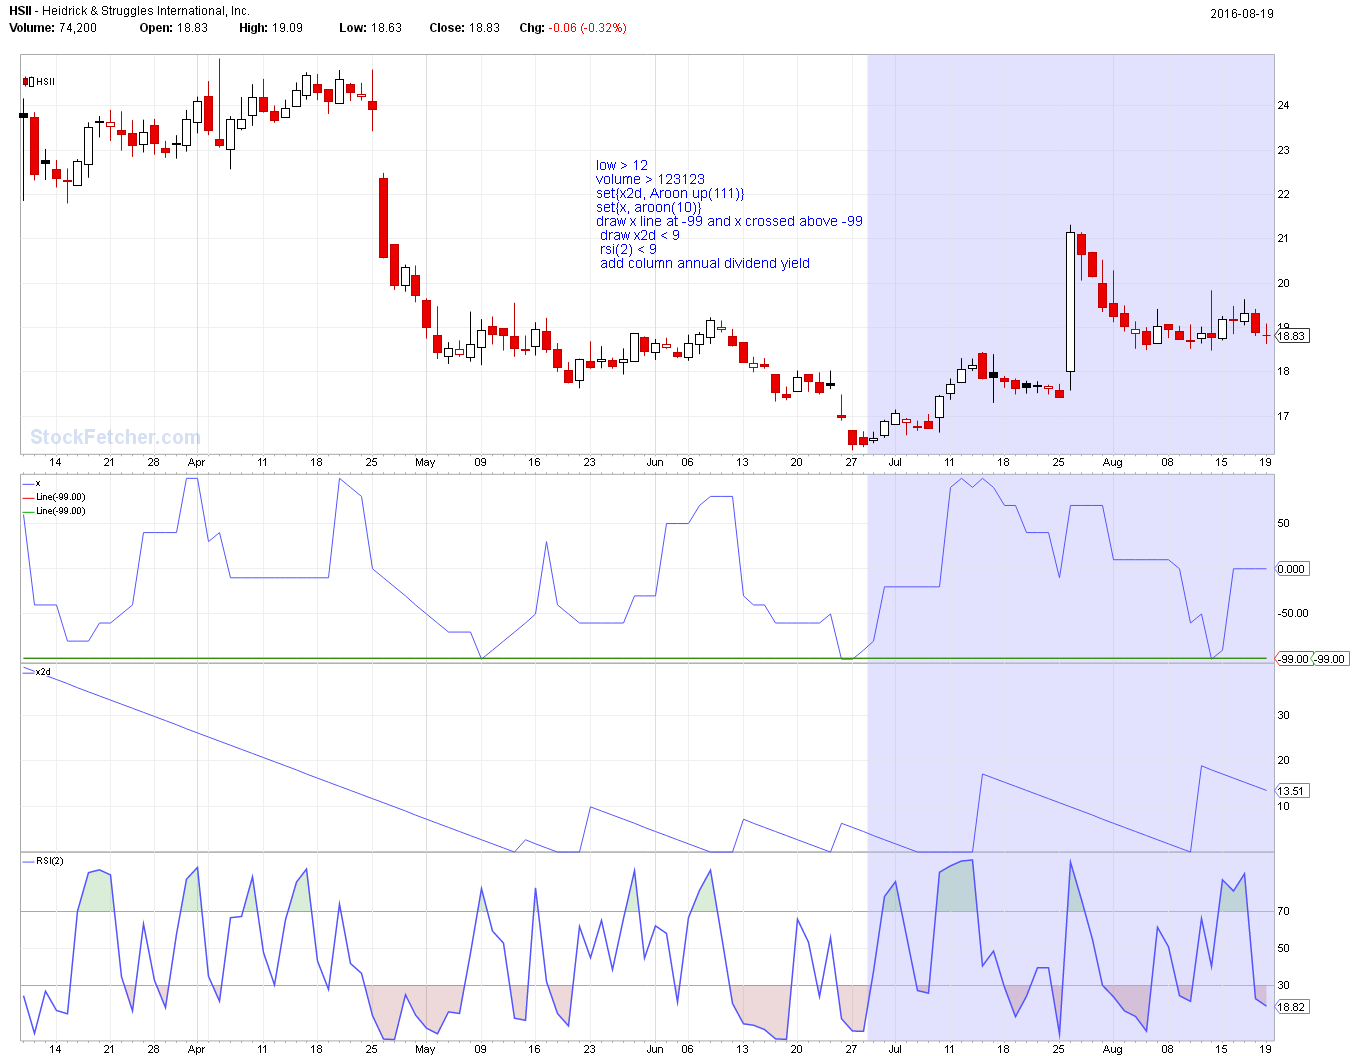 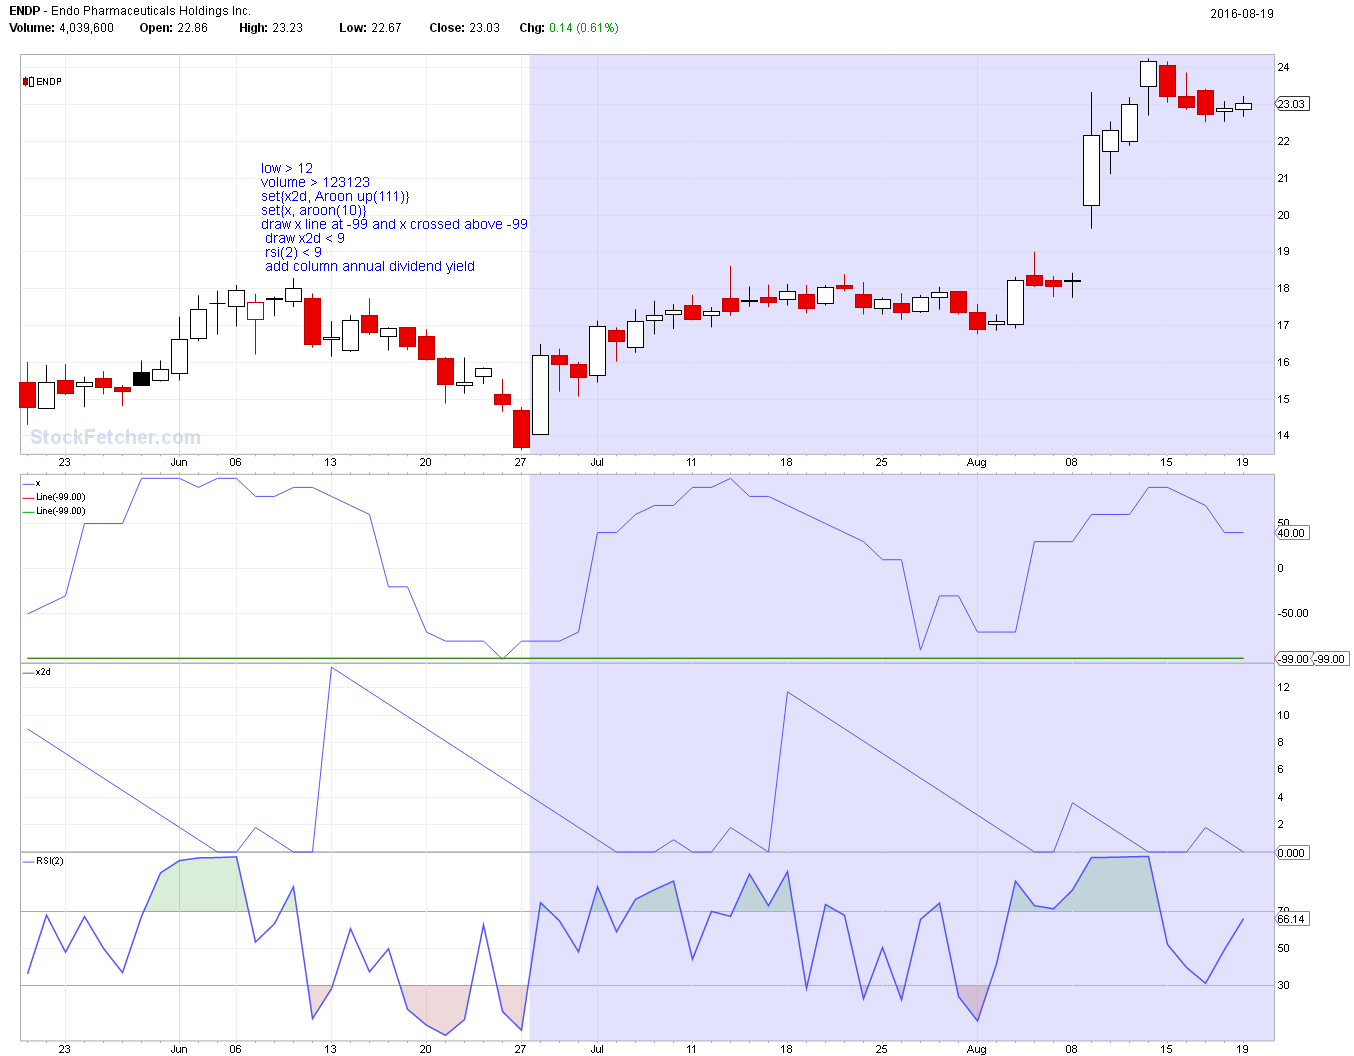 |
| ahcsim72 151 posts msg #130501 - Ignore ahcsim72 |
8/20/2016 1:17:12 AM I have not mentioned this before but your Aroon filter is one of the bests...I made some adjustments and I made some good $$ off it. Thanks! |
| four 5,087 posts msg #130502 - Ignore four |
8/20/2016 1:50:14 AM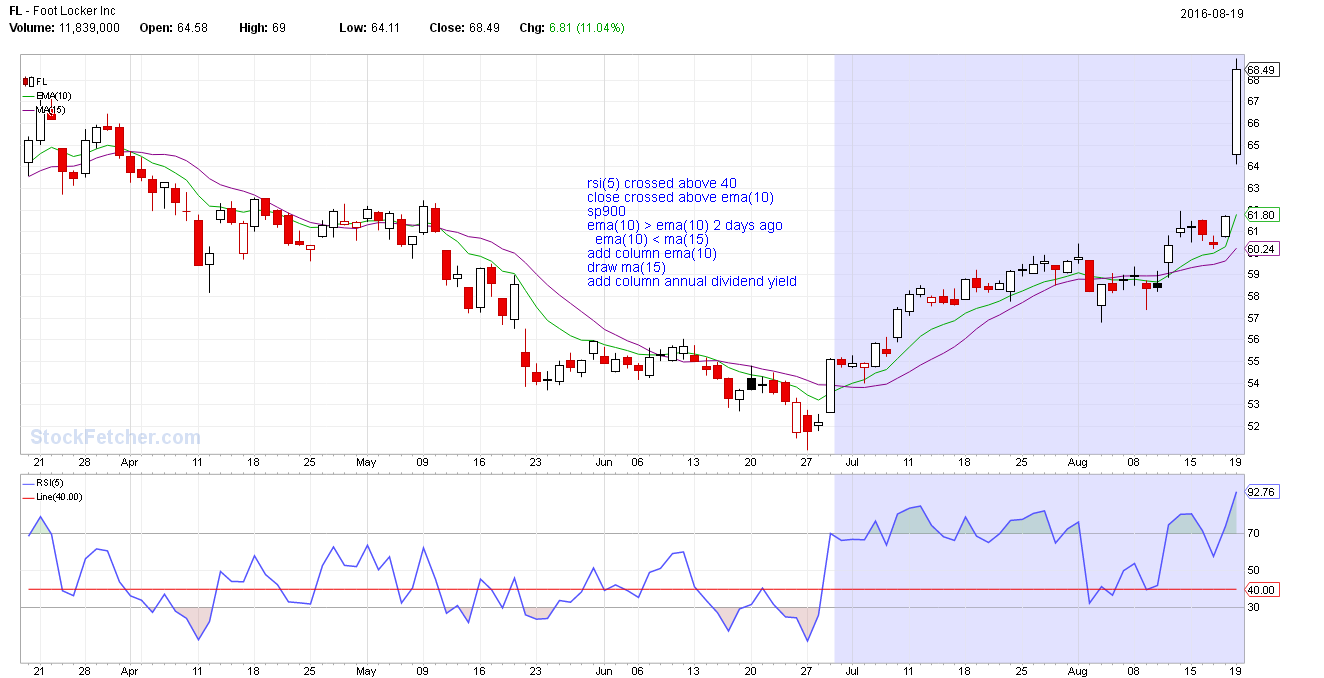 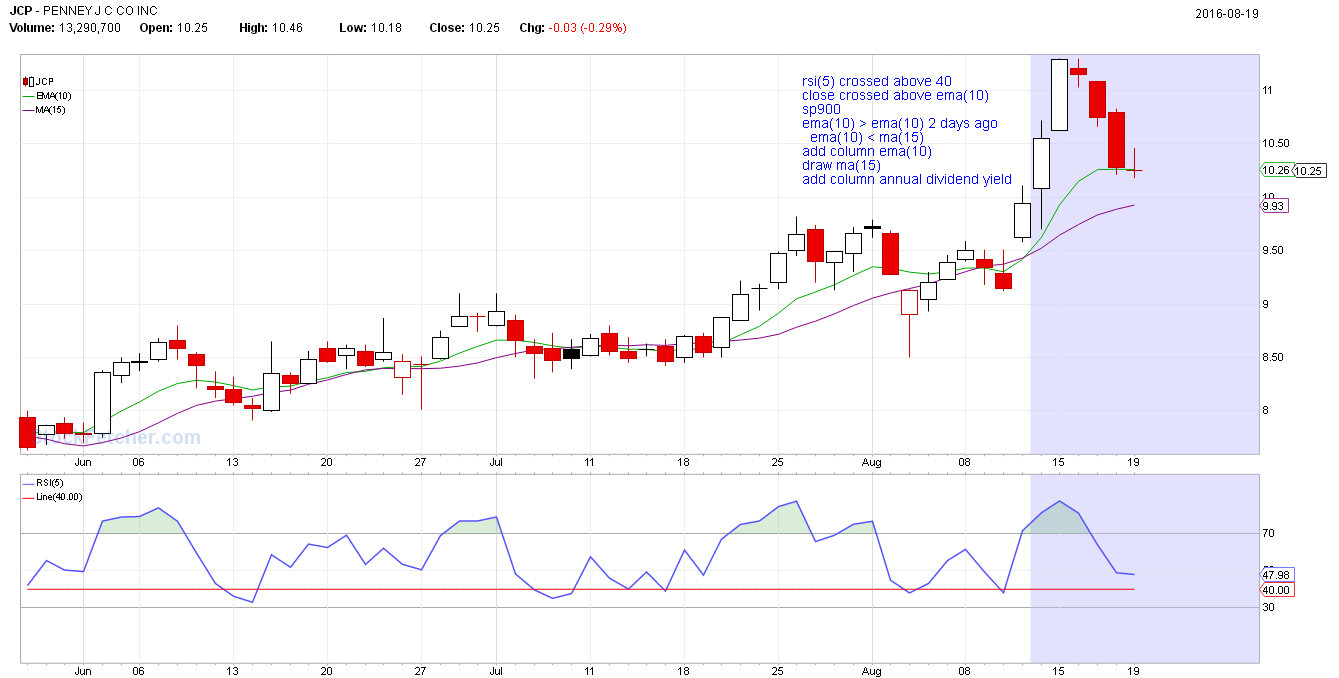 |
| four 5,087 posts msg #130503 - Ignore four |
8/20/2016 12:05:14 PM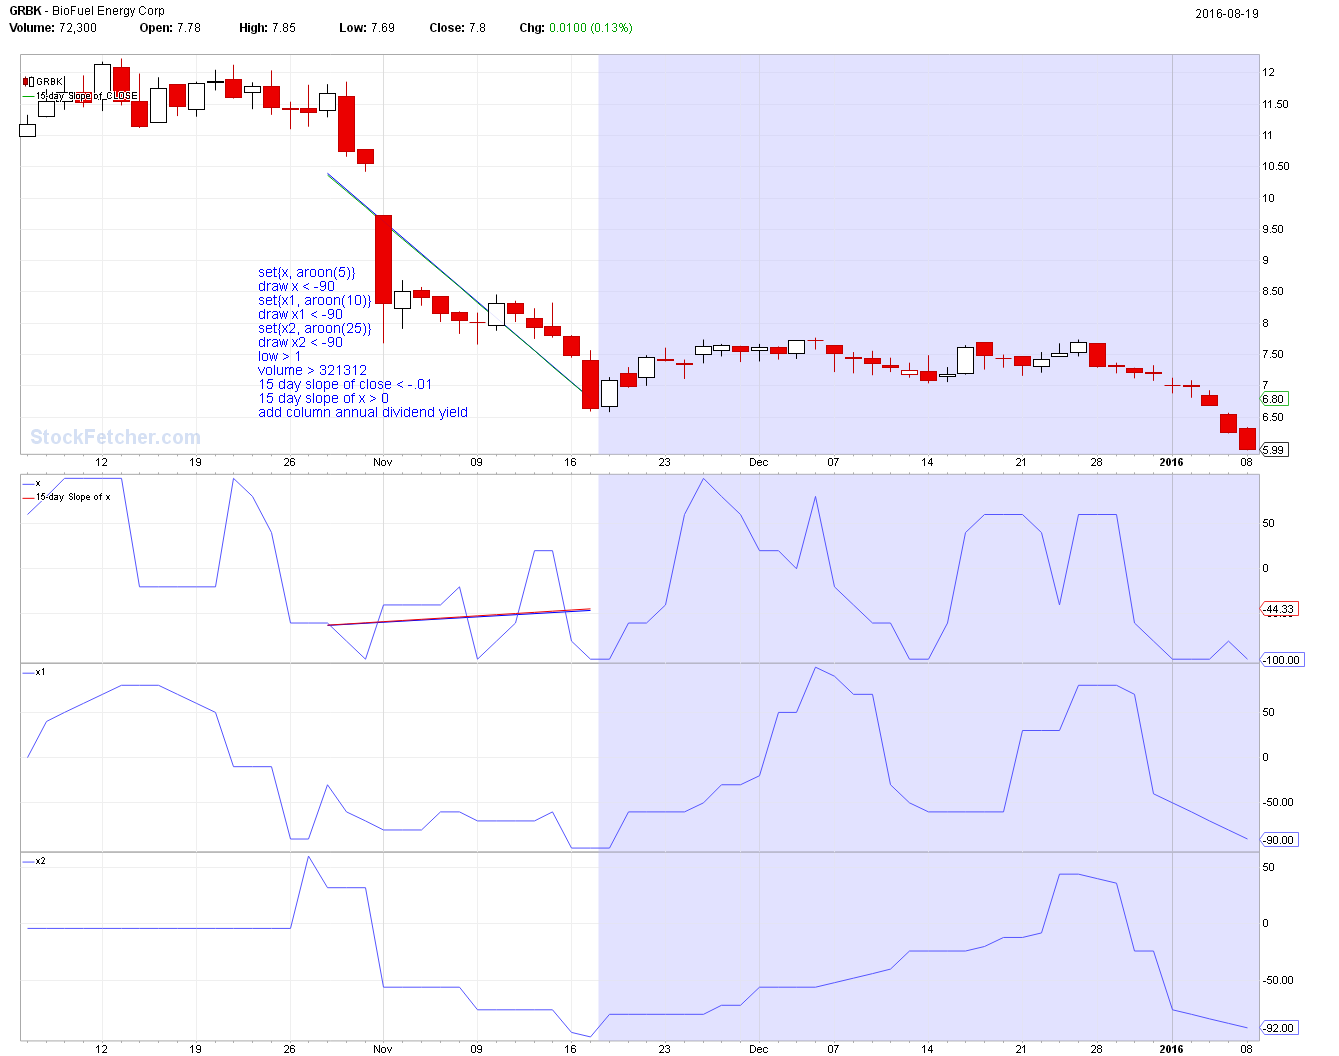 |
| four 5,087 posts msg #130504 - Ignore four |
8/20/2016 12:20:08 PM |
| four 5,087 posts msg #130505 - Ignore four modified |
8/20/2016 12:31:36 PM Borrowed Marlyn's code from: http://filteringwallstreet.blogspot.com/ and added mine /*http://filteringwallstreet.blogspot.com*/ PS offset to [Wednesday July 6, 2016 ] As Ed Seykota says, "One good trend pays for them all" http://www.seykota.com/tt/ |
| four 5,087 posts msg #130507 - Ignore four |
8/20/2016 3:14:26 PM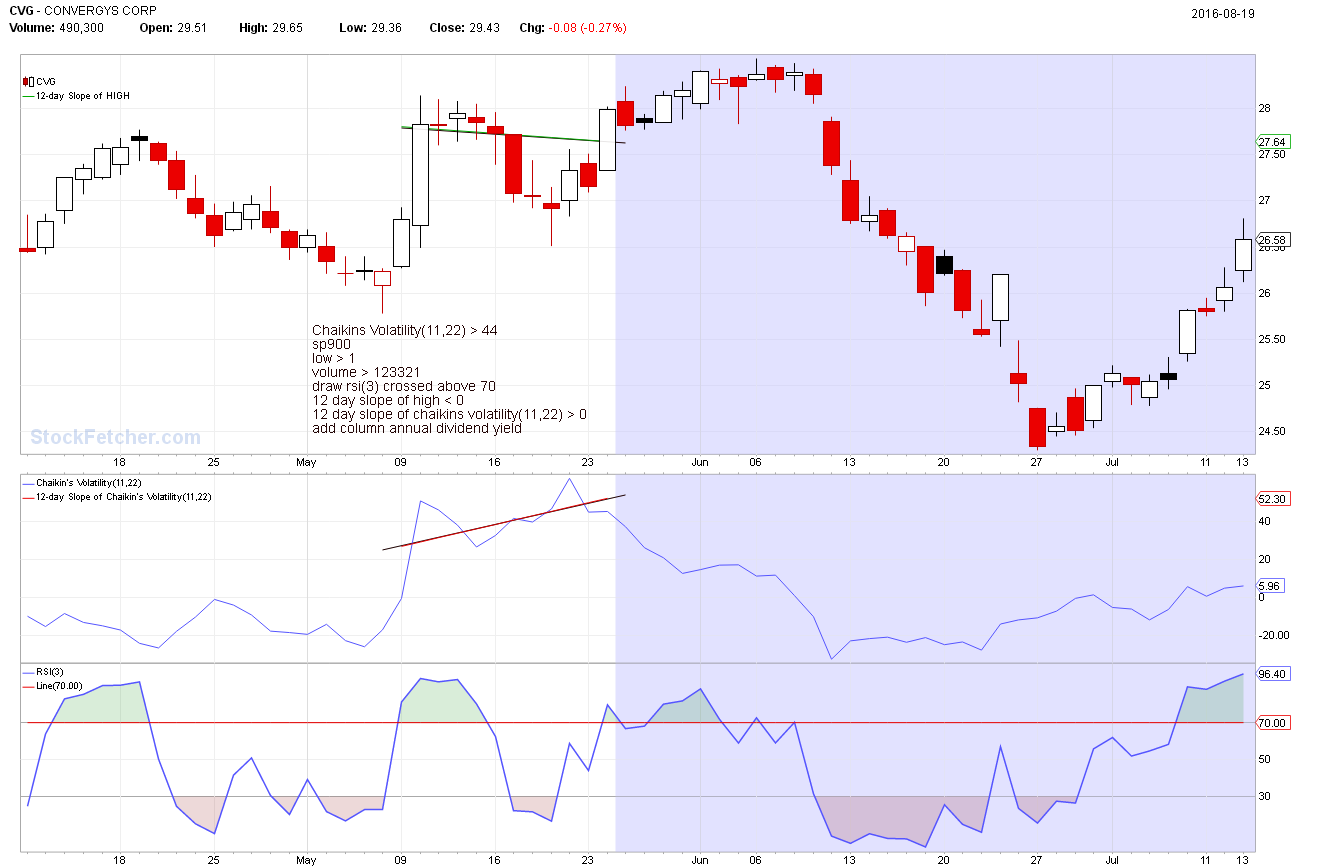   |
| four 5,087 posts msg #130508 - Ignore four modified |
8/20/2016 3:33:55 PM Borrowed Marlyn's code from: http://filteringwallstreet.blogspot.com/ and modified   |
| four 5,087 posts msg #130538 - Ignore four |
8/23/2016 10:26:00 PM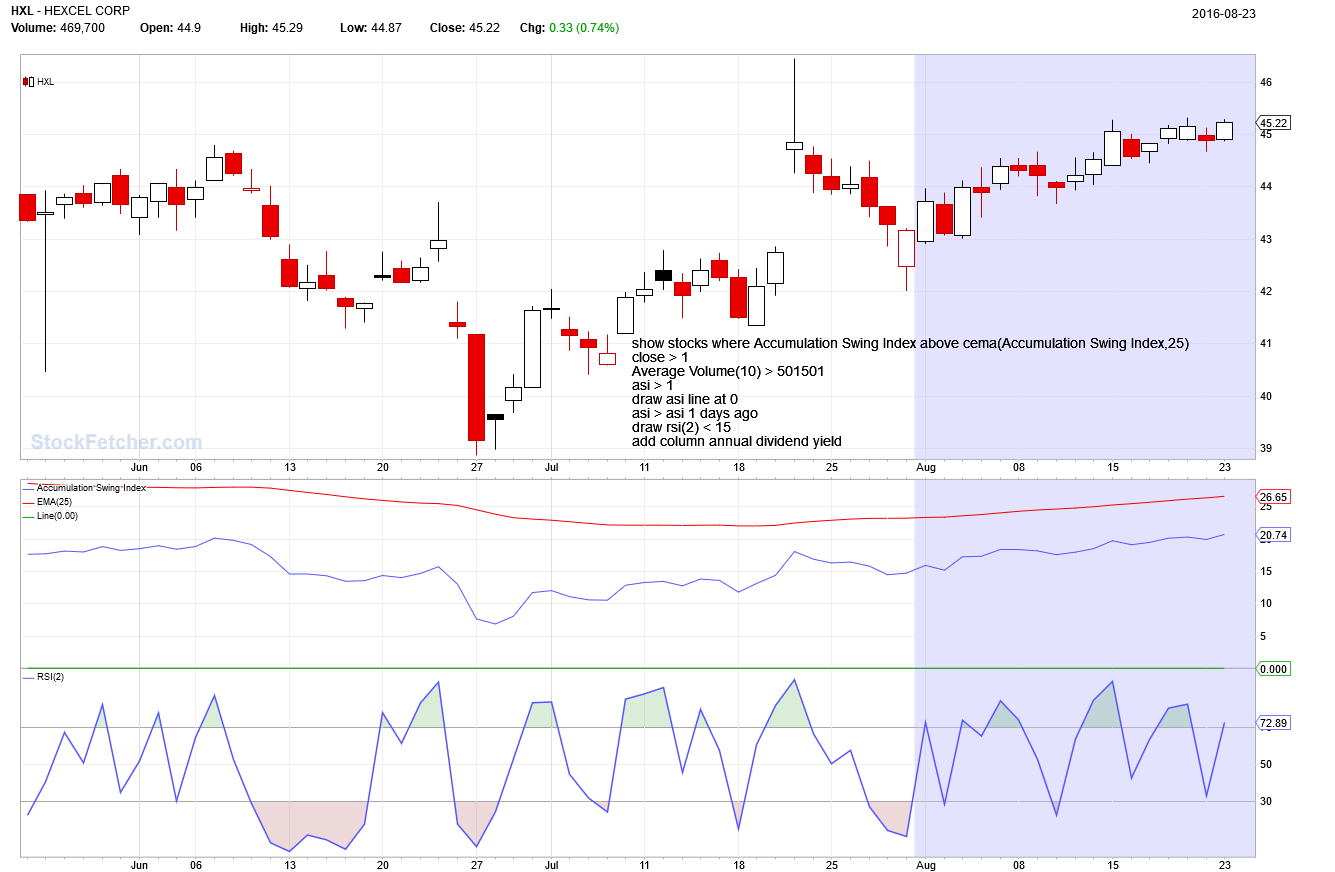 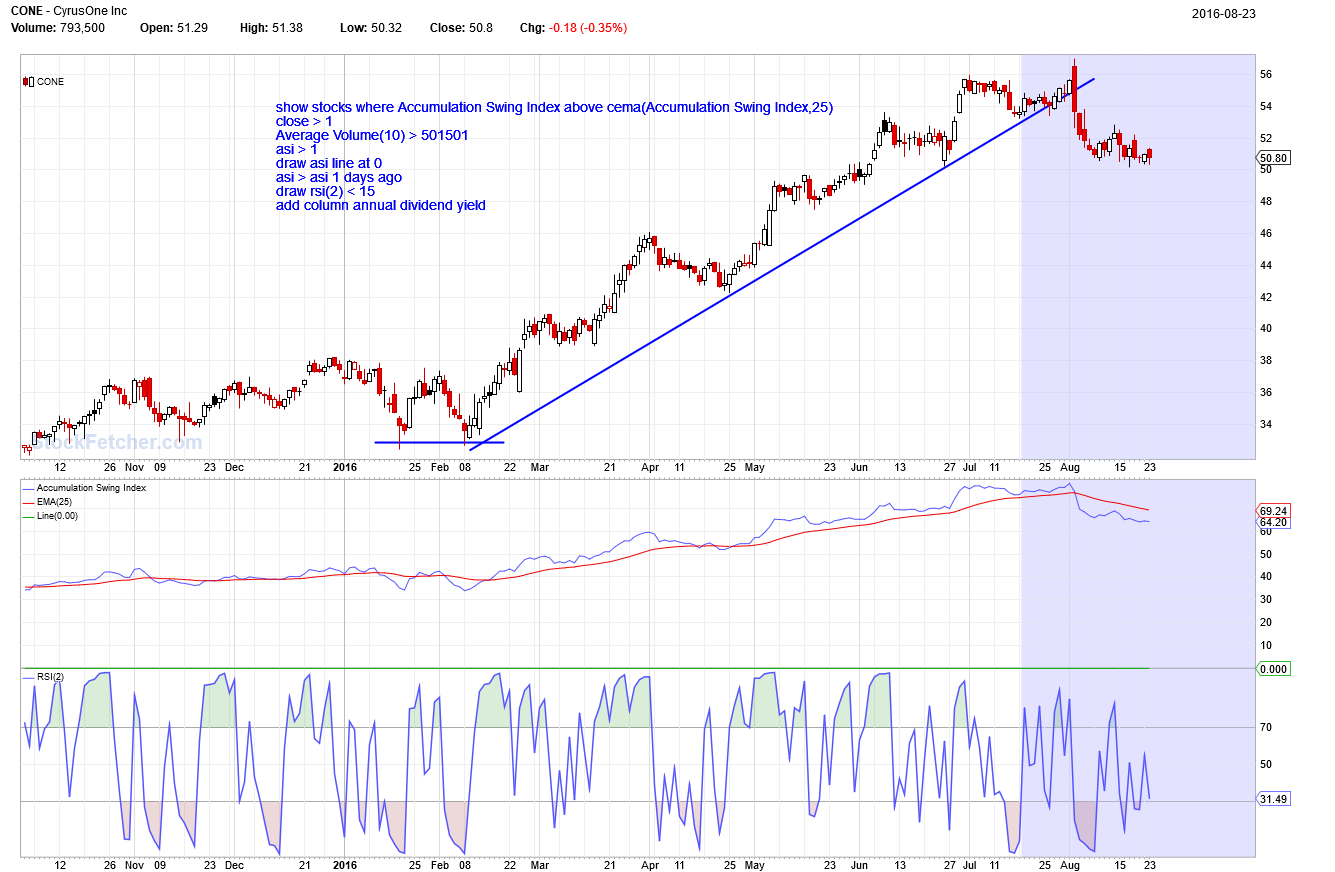 Better... 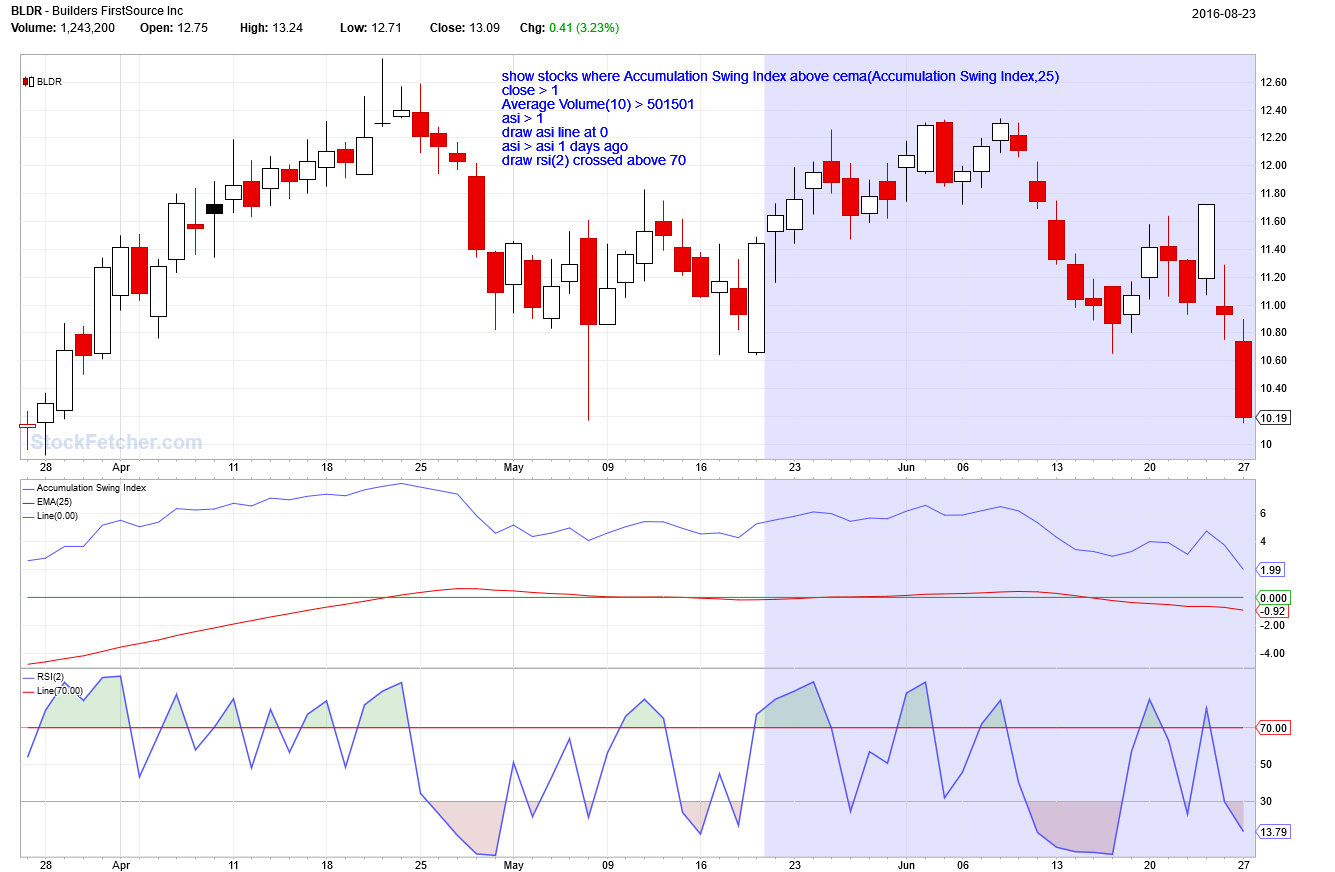 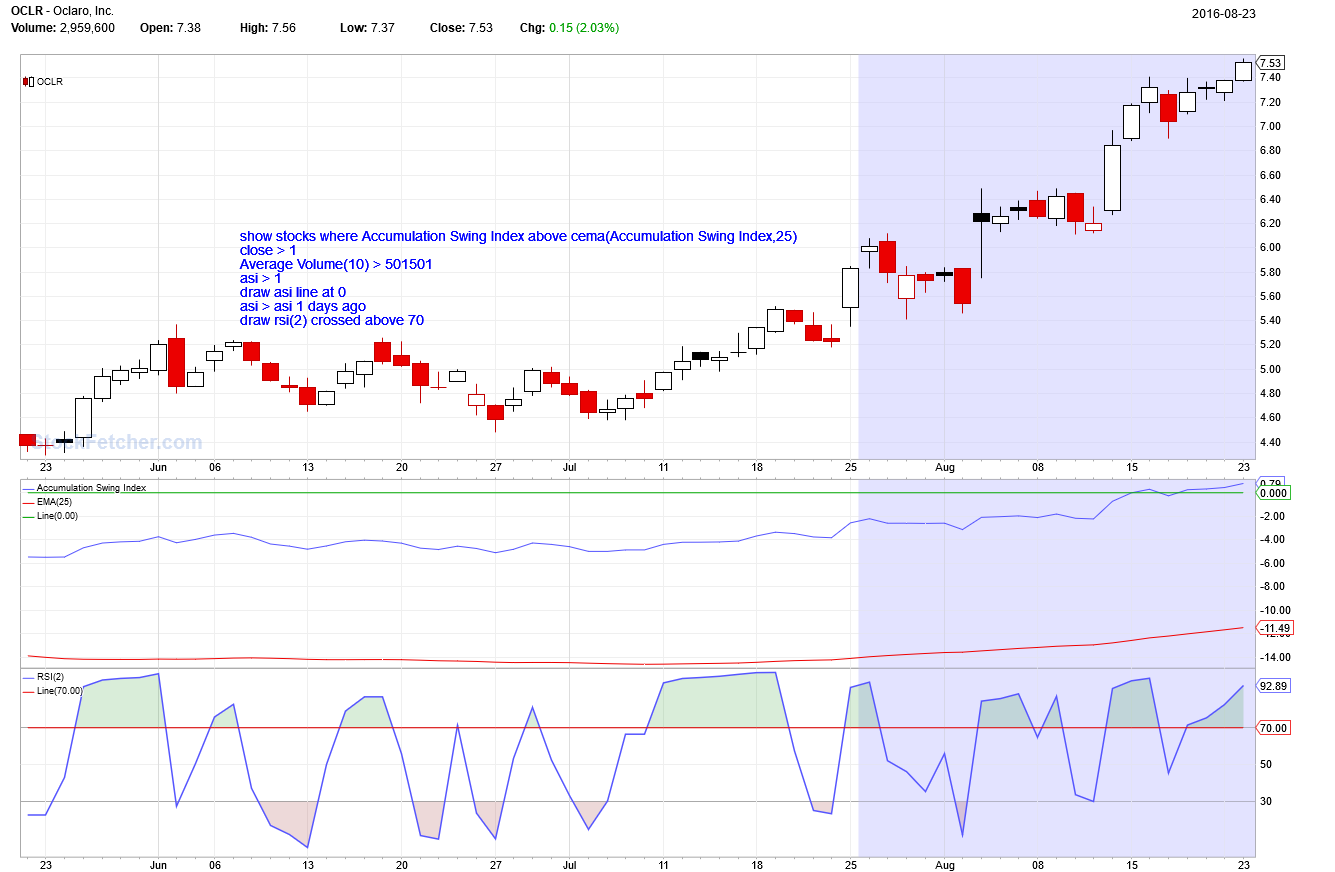  |
| four 5,087 posts msg #130539 - Ignore four |
8/23/2016 10:45:05 PM  |
| StockFetcher Forums · Stock Picks and Trading · Generic2 | << 1 2 3 4 5 ... 14 >>Post Follow-up |