| StockFetcher Forums · Stock Picks and Trading · The Price cross above EMA(13) thread. | << 1 2 3 4 >>Post Follow-up |
| dangreene 229 posts msg #128543 - Ignore dangreene modified |
5/18/2016 12:10:44 PM graftonian 98 posts msg #128515 - Ignore graftonian 5/17/2016 12:36:56 PM Did anyone see MGT coming! ------------------------------------------------------------- No, didn't see it coming but maybe the following filter may be of some use. Also, I don't mean to start a contest for 'the oldest' but I am 81. |
| graftonian 1,089 posts msg #128559 - Ignore graftonian modified |
5/18/2016 7:57:16 PM My picks that have recently crossed ema13 GBSN TROV, AMTD BAH EDZ |
| Mactheriverrat 3,172 posts msg #128594 - Ignore Mactheriverrat |
5/20/2016 10:49:18 AM LCI Resistance line breakout. 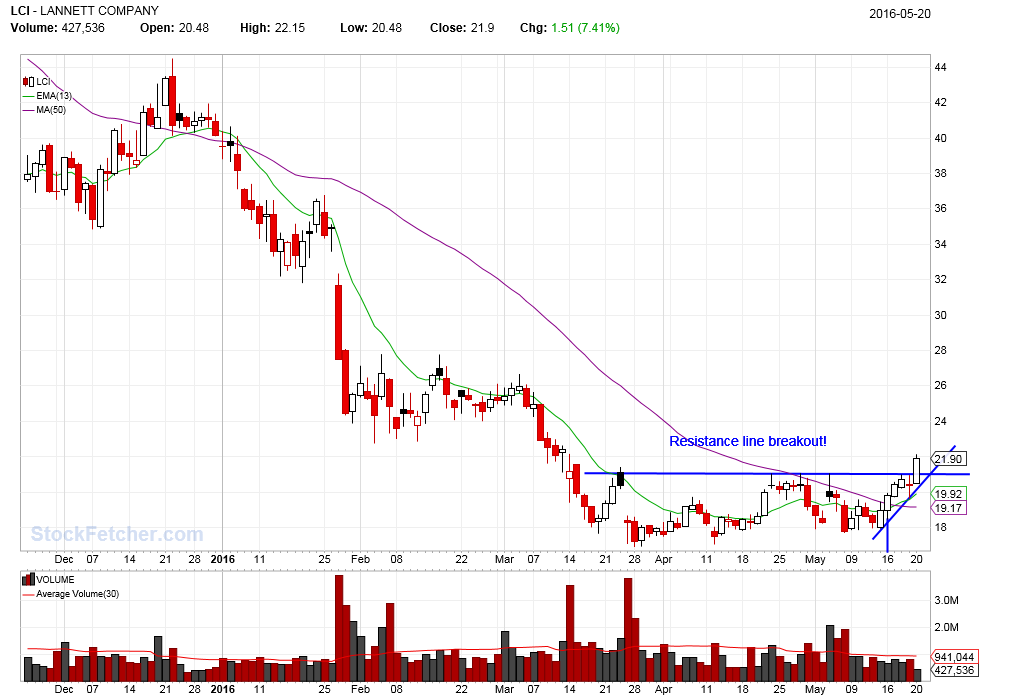 |
| Mactheriverrat 3,172 posts msg #128604 - Ignore Mactheriverrat |
5/20/2016 6:59:02 PM Looking at SYN Price broke above downtrend resistance line. 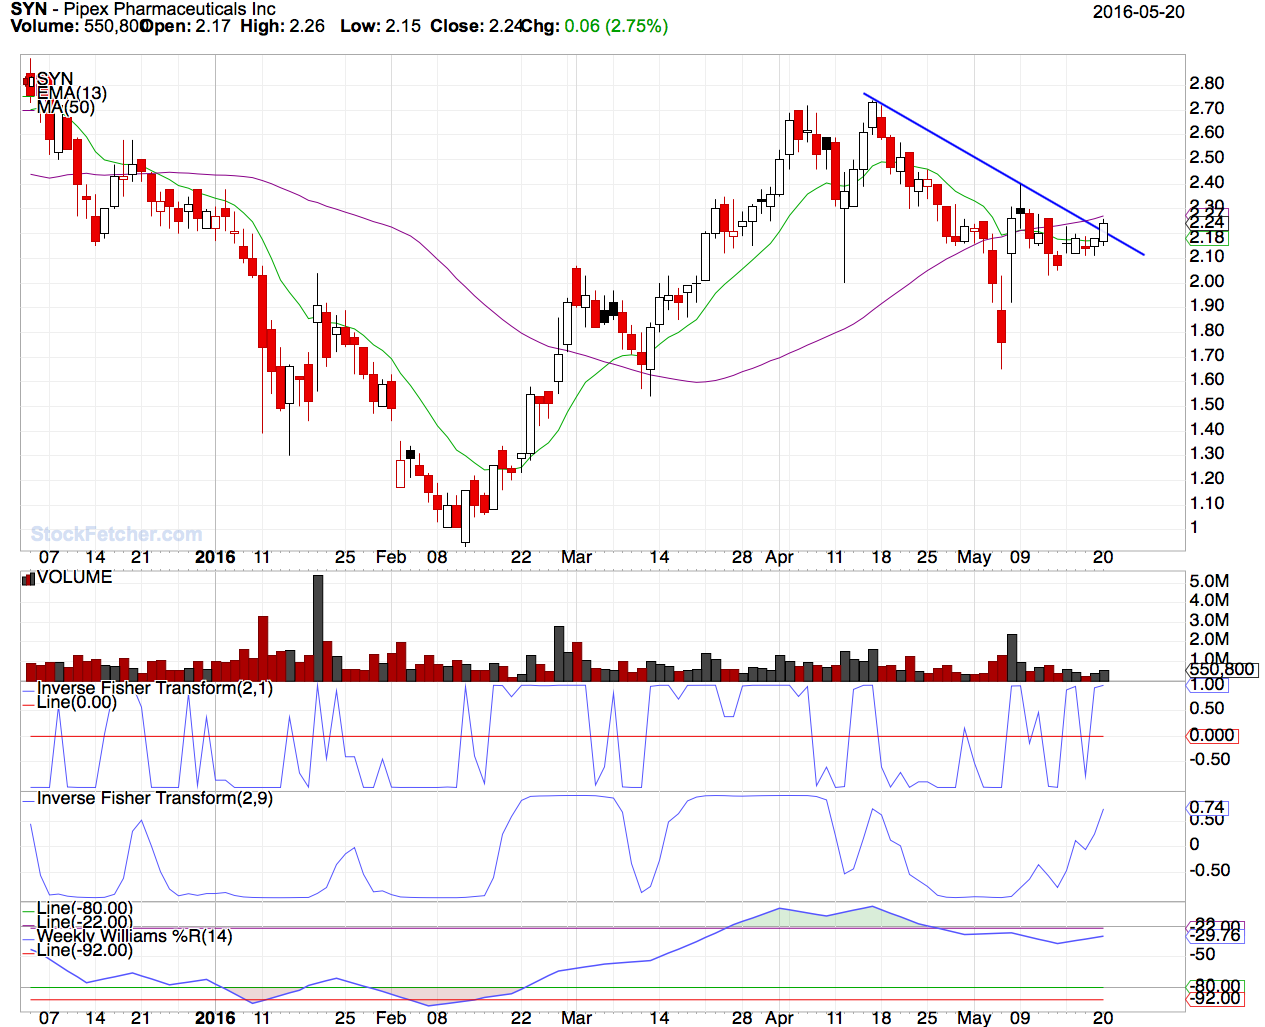 |
| pthomas215 1,251 posts msg #128608 - Ignore pthomas215 |
5/21/2016 10:01:31 AM mac, you are awesome. good description and your generosity is great. what are your thoughts about a stock looking good from an ema(13) standpoint but being right up against it's resistance. maybe TROV is in that category. |
| pthomas215 1,251 posts msg #128609 - Ignore pthomas215 |
5/21/2016 10:03:00 AM also mac, what SF code did you use to find LCI? Went up 2.50 ! |
| Mactheriverrat 3,172 posts msg #128610 - Ignore Mactheriverrat modified |
5/21/2016 12:07:23 PM On 7 month chart LCI showed up with price above. 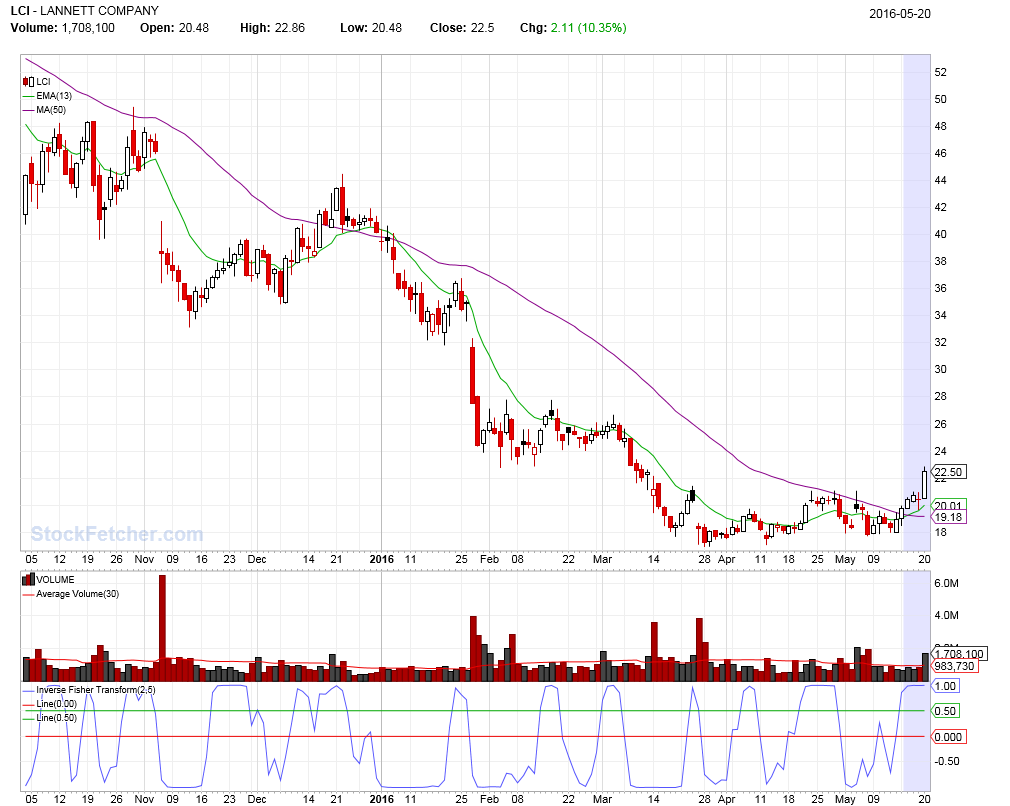 next draw a resistance line that was from the last couple of highs and a line below to make the day it came up. See the ema(13) start moving up then it crossed the MA(50) with is always a good sign. but the real ticker is when price breaks out of previous resistance line is call a breakout 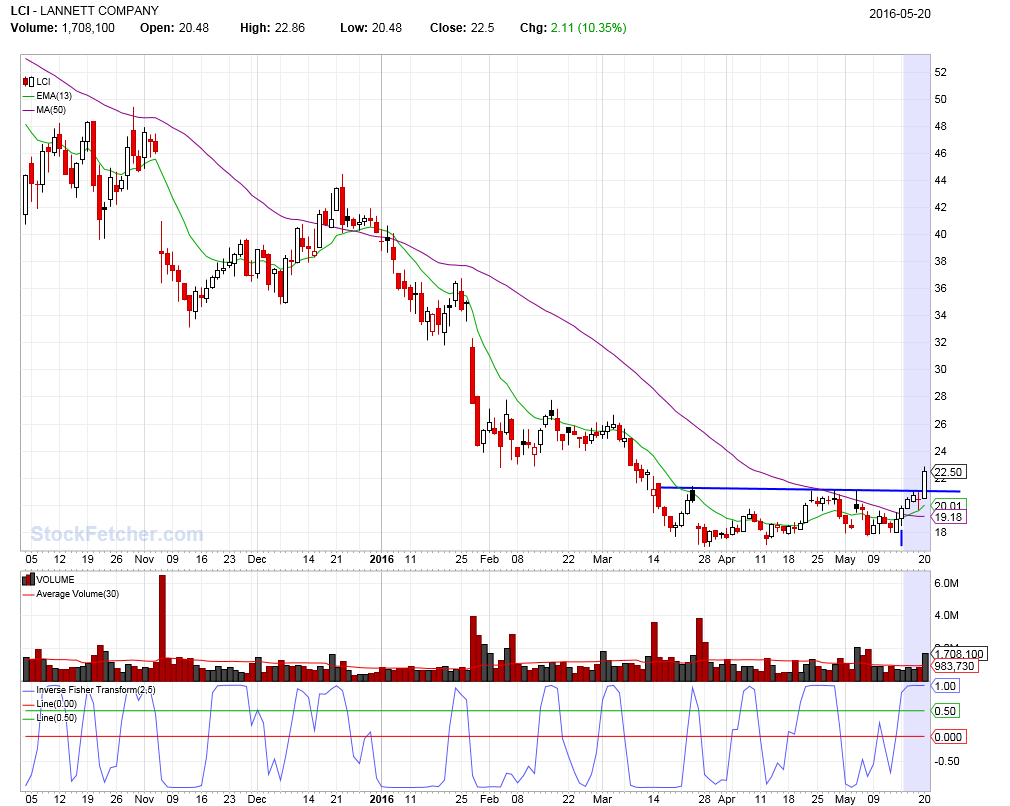 |
| Mactheriverrat 3,172 posts msg #128611 - Ignore Mactheriverrat modified |
5/21/2016 12:17:19 PM This is the filter I am using . |
| Mactheriverrat 3,172 posts msg #128612 - Ignore Mactheriverrat |
5/21/2016 12:25:49 PM SYN Broke down trend resistance line- IMHO it should make a run this next week.  |
| Mactheriverrat 3,172 posts msg #128613 - Ignore Mactheriverrat |
5/21/2016 1:23:14 PM What i'm trying to master is catch runs like SYN makes in the last 2 years. To me if that is mastered then one can really control their Financial Destiny.  |
| StockFetcher Forums · Stock Picks and Trading · The Price cross above EMA(13) thread. | << 1 2 3 4 >>Post Follow-up |