| StockFetcher Forums · General Discussion · ConnorsRSI | << 1 ... 7 8 9 10 11 ... 32 >>Post Follow-up |
| Nickster8074 53 posts msg #109455 - Ignore Nickster8074 |
12/17/2012 11:45:45 AM I've seen a lot of discussion about the entry point (down 6%) and exit point (RSI(2)>50), is there any thoughts about a stop loss or some downside protection? |
| gmg733 788 posts msg #109458 - Ignore gmg733 |
12/17/2012 3:47:19 PM Go and see Kevin's comments on programming Prodigio. Enter on a candle that is a tick above the pullback. This helps you prevent against a position that just keeps dropping. A great suggestion from Kevin. The results for this system are VERY good. I don't think I'd bother improving the 'wheel' at this point. And for those with a day job, this is a very manageable system. Very binary and non-emotional! |
| duke56468 683 posts msg #109465 - Ignore duke56468 |
12/17/2012 5:53:11 PM Kevin or mahkoh... is there a way to write the the filter so it shows stocks that reached the 6% low on the second day? |
| Kevin_in_GA 4,599 posts msg #109466 - Ignore Kevin_in_GA |
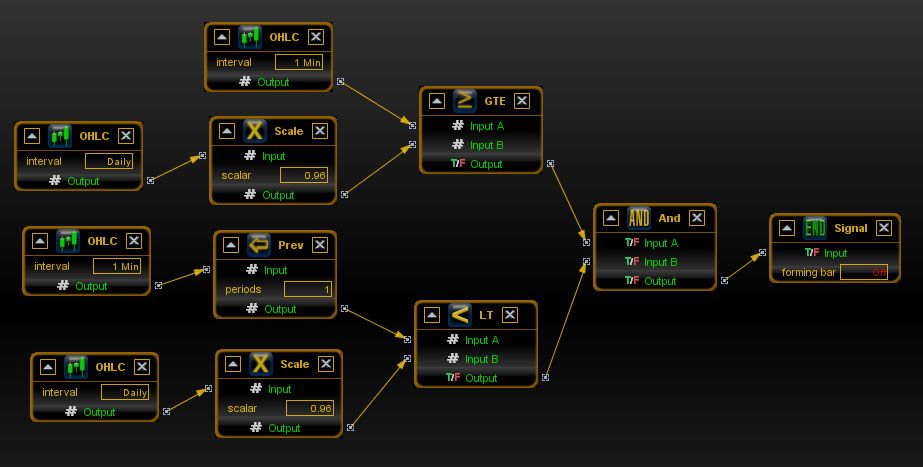
12/17/2012 5:58:59 PM Here is the code for a 4% pullback (just change the "scale" module to 0.94 to get a 6% pullback). Note that a trade will only be triggered if the current 1 min bar closed ABOVE the trigger while the previous 1 min bar close BELOW. There are rare instances where the cross below and back above occur within the same 1 min bar - you can go down to as short a time frame as 5 seconds if that meets your needs. Also note that this rule is applied to a pre-selected list derived from SF the night before. 
Kevin |
| gmg733 788 posts msg #109471 - Ignore gmg733 modified |
12/17/2012 11:28:27 PM Wow. That looks familiar. I did look at the previous 1 min bar 'low' was below the previous closing bar low. :) |
| jackmack 334 posts msg #109476 - Ignore jackmack |
12/18/2012 8:06:24 AM Thank you posting this Kevin. Not as complicated as mine ;-) Cheers |
| compound_gains 225 posts msg #109477 - Ignore compound_gains |
12/18/2012 8:11:44 AM For anyone who's interested... This script lets you troll day-by-day to see which stocks hit and what the closing performance was for the next five days (including the entry day) along with the closing RSI(2) for each day. In most cases you are out of the trade within five days based on the closing RSI(2), unless it's a dog. There are no commissions or bid/ask spreads factored into the entry price, but you can easily add those if you want. No doubt there are many trades with impressive returns, but there are also any number that will rip your face off. Conclusion: You can't blindly trade this without some kind of entry management...such as Kevin has talked about...and some kind of firm or mental stop loss...perhaps 8%. There's also an element of luck in which stock hits first on days when more than one stock hits and how that first one eventually performs. PTTA (Profitable Trading To All) |
| Kevin_in_GA 4,599 posts msg #109492 - Ignore Kevin_in_GA |
12/18/2012 1:43:12 PM No doubt there are many trades with impressive returns, but there are also any number that will rip your face off. Conclusion: You can't blindly trade this without some kind of entry management...such as Kevin has talked about...and some kind of firm or mental stop loss...perhaps 8%. There's also an element of luck in which stock hits first on days when more than one stock hits and how that first one eventually performs. ++++++++++++++++++++++++++++++++++++++++++ 1. The use of a "cross above" strategy is a form of entry management in that it keeps you out of a few unprofitable scenarios, but also important is position sizing (and if you follow Connors' approach the occasional doubling down on a trade). 2. I developed this approach without the use of a stop loss. In all cases - all of them - the introduction of a stop loss resulted in both lower overall returns and a lowered Sharpe ratio. 3. In real life the trades are entered solely on timing, not by any selection method. Therefore I typically ignore the returns if they are based on something like "rsi(2) ascending" and only use Monte Carlo results with n = 1000 or more. I do like to see that if one picks the lowest RSI you see the best returns, etc since that shows that this is an important variable in the filter. However, beyond that I only use Monte Carlo data (and more importantly, a walk-forward analysis that shows nearly similar results). I have moved beyond this initial set of conditions in favor of using the williams %r(2), and using whatever this month's WFA selected set of values is. |
| jackmack 334 posts msg #109504 - Ignore jackmack |
12/18/2012 10:37:45 PM Kevin Sorry but I do not follow the "using williams %r(2)? What are you using that for? Is that a new exit rule? Thank you |
| gmg733 788 posts msg #109530 - Ignore gmg733 |
12/20/2012 10:12:47 AM HLF just hit a buy. |
| StockFetcher Forums · General Discussion · ConnorsRSI | << 1 ... 7 8 9 10 11 ... 32 >>Post Follow-up |