| StockFetcher Forums · General Discussion · ConnorsRSI | << 1 ... 8 9 10 11 12 ... 32 >>Post Follow-up |
| wkloss 231 posts msg #109535 - Ignore wkloss |
12/20/2012 12:31:12 PM A couple of questions 1. Re: HLF just hit a buy. Would the entry have been after it had gone below $35.10 the 1st time this morning and then traded above $35.10 around 10:04 AM EST? It looks like it has gone below $35.10 3 times this morning. 2. Does anyone have knowledge or even an opinion as to why this system backtested so well during the bear market that started in 2008? Buying stocks that just experienced 2 back to back drops of 6% or more during a really serious downturn suggests that would they would keep heading down but the equity curve shows otherwise and in fact, this system had a very small drawdown. |
| sohailmithani 192 posts msg #109537 - Ignore sohailmithani modified |
12/20/2012 1:28:06 PM Kevin, I used your filter as follows: set{trigger, close 1 day ago * 0.94} close above 5 close is below day position(0.2,1) average volume(21) above 250000 adx(10) above 30 low below trigger Buy limit at 6% below close bought 10 for $10000 each with max equity of $100,000 and tested it for several years but could not match your results of avg 4.26% per trade. I could only get 1-2%. Would you know why/ |
| shainadir 25 posts msg #109539 - Ignore shainadir |
12/20/2012 1:51:31 PM Catching these falling knives can be tough. Bought HLF at 35.10 and then set stop to break even after price got to 36.10. Price reversed and went to a low of 33.05. |
| BarTune1 441 posts msg #109545 - Ignore BarTune1 |
12/20/2012 5:00:59 PM There is nothing particularly tough about this system or its plays. Its mechanical - you play it - on average you should/will win. If 35.10 was the limit entry price, you would have been in when it hit it. I sometimes wait till the end of day, which obviously would have been more beneficial today. I don't think there is any evidence for the assertion that simply because a stock dropped back to back days of 6% that there would be an expectation that it would keep heading down. If that were the expectation, you ought to short those stocks and, perhaps by analogy, buy the ones that go up 6% two days in a row. The majority of Connors systems are reversion to the mean on the basis that a tradable majority of stocks trade like a rubber band on the short term, getting overbought and oversold, from time to time, as the case may be. His research, as validated by Kevin's work and backtesting, proves this is exactly so more often than not. |
| Kevin_in_GA 4,599 posts msg #109546 - Ignore Kevin_in_GA |
12/20/2012 5:07:05 PM I used your filter as follows: set{trigger, close 1 day ago * 0.94} close above 5 close is below day position(0.2,1) average volume(21) above 250000 adx(10) above 30 low below trigger Buy limit at 6% below close bought 10 for $10000 each with max equity of $100,000 and tested it for several years but could not match your results of avg 4.26% per trade. I could only get 1-2%. Would you know why 1. Make sure you are using the same exit. 2. The order of selection of stocks is likely different. 3. Most importantly, the results I quoted are MONTE CARLO results and thus are a more accurate estimate of system performance than any one set of backtest results (this addresses point #2 above). |
| sohailmithani 192 posts msg #109547 - Ignore sohailmithani modified |
12/20/2012 5:54:14 PM Thanks Kevin. Selection Method: select by RSI(2) ascending Exit : RSI(2) > 50 Any difference here? I tested from 2002 till 2012 but did not get close to 4.26% |
| Kevin_in_GA 4,599 posts msg #109551 - Ignore Kevin_in_GA |
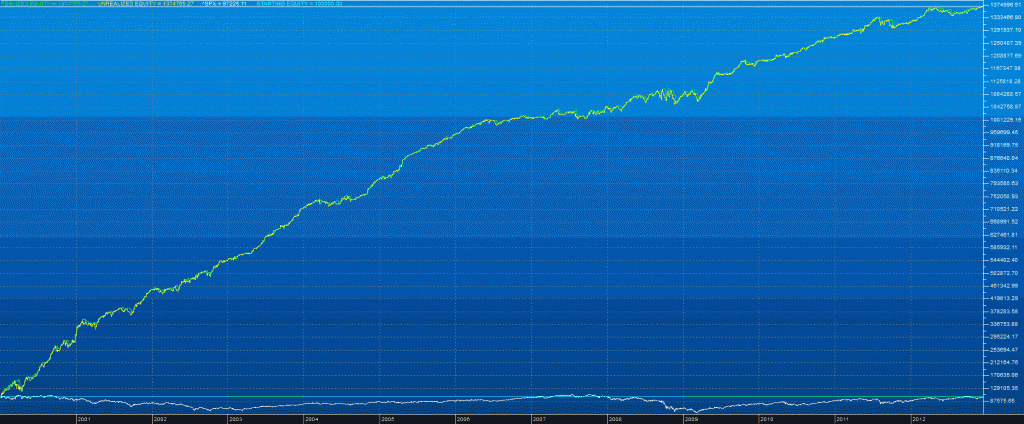
12/20/2012 8:39:57 PM Not surprised. Using the same settings I get the following equity curve and stats: Equity curve for 12/31/1999 until 12/12/2012: 
Stats: 
These are actually quite impressive, but please look at the Monte Carlo data I posted in the first page of this thread. The MC annual return is over 160% and the average trade return is 4.98%. What this tells me is that selecting by RSI(2) ascending is actually LESS profitable than using a random entry for the backtest. What matters is not the backtest results as much as the WFA results, since the latter is always generated against Out-Of-Sample data and is therefore more realistic. I now basically choose systems based on the Monte Carlo analysis of the WFA. |
| sohailmithani 192 posts msg #109552 - Ignore sohailmithani |
12/20/2012 8:47:14 PM Thanks. So what has been your WFA results so far. impressive I guess? Since when have you started implementing it actually and what has been the success rate and % return? |
| Kevin_in_GA 4,599 posts msg #109553 - Ignore Kevin_in_GA |
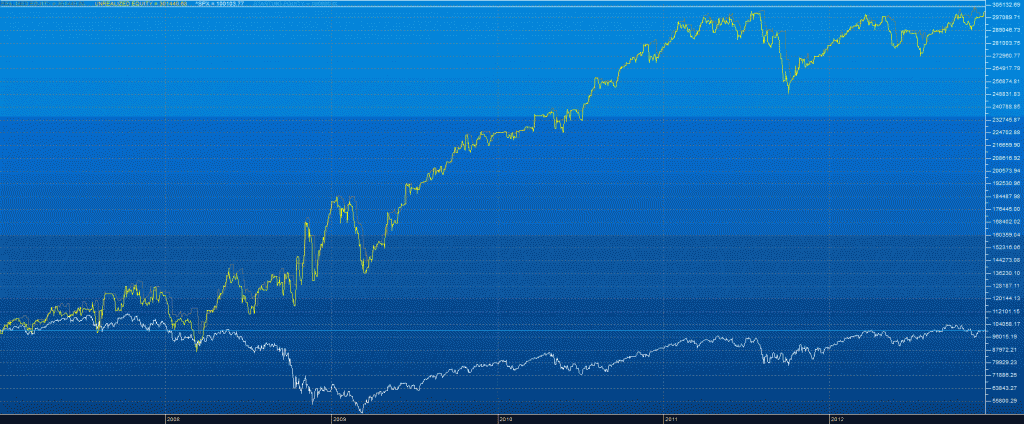
12/20/2012 10:01:25 PM WFA results are almost always lower than the best backtest result - again, this is because the backtest finds an optimal outcome from known data whereas a WFA is always challenged by new data. I finished several Walk-Forward Analyses on this system, adding in "RSI(2) < X" to the entry. I limited the time period to 1/2/2007 until now to avoid giving too much credit to the past. As I said earlier, a WFA looks back some period of time, picks the best system, and then trades it forward for a month. At the end of the month, the process is repeated, a new winner is selected, and that is traded forward. The system thus dynamically adjusts its settings based on recent performance, and the results are never derived from "backtesting" but only from new data the system has never seen before. Here are the parameters I used in SS to do this:
Here is the WFA equity curve for the RSI-based system: 
Note all that impressive, but the Monte Carlo results are still solid at 119% MC average annual return. |
| wkloss 231 posts msg #109555 - Ignore wkloss |
12/21/2012 12:27:35 AM BarTune1 Re :I don't think there is any evidence for the assertion that simply because a stock dropped back to back days of 6% that there would be an expectation that it would keep heading down. It wasn't an assertion, just a question. It seems logical that reversion to the mean works just fine during sideways or uptrending markets. It seems counter intuitive to me that this system had such small drawdowns during such a vicious down market, yet Kevin's fine research shows otherwise. I wasn't trying to saying Kevin was wrong; I was just trying to say I didn't understand how & why. Why would be a good thing to know if we have another move down like that. Connors has been at trading research for decades. Perhaps even Connors would have questioned results like these and asked "why does it work this way in down markets" until the evolution of his research brought him to the conclusion that this concept works just fine in extreme markets. Anyway, thanks to you and Kevin for your contributions. Bill |
| StockFetcher Forums · General Discussion · ConnorsRSI | << 1 ... 8 9 10 11 12 ... 32 >>Post Follow-up |