| StockFetcher Forums · General Discussion · Any swing traders here?? | << 1 ... 21 22 23 24 25 >>Post Follow-up |
| Quilln 116 posts msg #113122 - Ignore Quilln |
5/3/2013 11:47:08 PM Four, this is an excellent chart displaying the Tetter Totters for the 2x and 3x pairs. thank you very much Best regards, Quilln - |
| tennisplayer2 210 posts msg #113129 - Ignore tennisplayer2 |
5/4/2013 9:07:38 PM Quilln, XLE and OIH have the ema (13) cross above the ema (50). In your opinion, is this worth a try? Thanks and hope all is well. |
| Quilln 116 posts msg #113481 - Ignore Quilln |
5/17/2013 12:10:01 AM Tennis, I am sorry for the delay, but your correct to buy at the xovers. Now, the Keltner charts will show solid confirmations before xovers occcur. I have been leaning more and more to the bottom panel of the Ketlner charts. do some research and paper trading on the keltner charts using the bottom panel. http://stockcharts.com/h-sc/ui?s=OIH&p=D&yr=0&mn=4&dy=0&id=p70095837779 http://stockcharts.com/h-sc/ui?s=OIH&p=D&yr=0&mn=2&dy=0&id=p21113770024 Keltner http://stockcharts.com/h-sc/ui?s=XLE&p=D&yr=0&mn=4&dy=0&id=p82275114633 http://stockcharts.com/h-sc/ui?s=XLE&p=D&yr=0&mn=2&dy=0&id=p36892148749 Keltner cheat sheets......on how to trade by buying and selling http://www.onlinetradingconcepts.com/TechnicalAnalysis/RelativeStrengthIndex.html http://www.onlinetradingconcepts.com/TechnicalAnalysis/CommodityChannelIndex.html Just a thought, Quilln - |
| tennisplayer2 210 posts msg #113483 - Ignore tennisplayer2 |
5/17/2013 6:42:31 AM Quilln, thanks for the reply and help. Here's a filter to screen for stocks that crosses from below -100 on CCI(20). |
| Quilln 116 posts msg #113496 - Ignore Quilln |
5/17/2013 10:48:48 AM Tennisplayer2, Thank you very much for the script. This cuts down a lot time of searching on the barchart.com site. Best regards, Quilln - |
| four 5,087 posts msg #113501 - Ignore four modified |
5/17/2013 11:52:55 AM Update to post found: 5/2/2013 10:23:41 PM Hey Quilln, Crossover has WORKED this time... 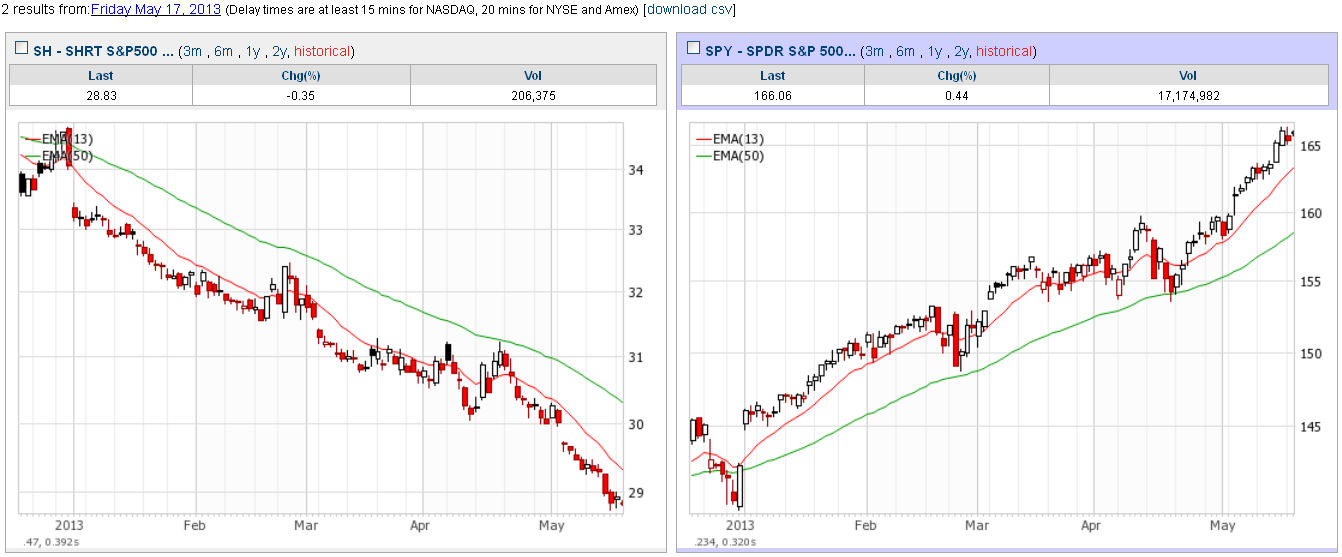
|
| Quilln 116 posts msg #113529 - Ignore Quilln |
5/18/2013 12:05:13 AM four, thank you very much for the heads up. If you own SPY, let's enjoy the ride and wait for the next crossover. The folks who own /ES or /ESM13 (cboe E-mini S&P 500) must be having a great ride as well. http://stockcharts.com/h-sc/ui?s=%5EESM13&p=D&yr=0&mn=8&dy=0&id=p37527184046 for about 264 points and I think about 13,200.00 profit on one lonely contract and still climbing. best regards Quilln- |
| dashover 229 posts msg #113578 - Ignore dashover |
5/21/2013 11:24:44 AM Quilln, Let me make sure I am clear. You mostly trade related / inverted shares like sso/sds spy/sh and use a daily chart with a 13/50 sma crossover and switch when necessary? or do you get the long term picture using a 1 year daily chart and move the analysis to a daily chart using the same ma's on a 1 min chart etc. Please clarrify? Thx! Could you also show using sso/sds when you would have entered the trade, when you would have decided you were wrong, how you deal with whipsaws etc. Thanks!!! Dash |
| Quilln 116 posts msg #113594 - Ignore Quilln |
5/21/2013 10:32:22 PM Dashover, We are using the Tetter Totter principle. Werks only with pairs such as the 3x and 2x ETF's. You will always be in one of the pairs at all times as you plow through the other pairs if you saw my Million Dollar Portfolio (MDP). the following charts is what I use. http://stockcharts.com/c-sc/sc?s=spy&p=15&b=9&g=3&i=p03097103070&a=159176998&r=8510 this is a kwik chart just to see if the stock is still moving up and up or getting close to the xover to sell the stock. http://stockcharts.com/h-sc/ui?s=SH&p=D&yr=0&mn=7&dy=0&id=p96545969004 would have sold SH on or about Decemember 2nd then http://stockcharts.com/h-sc/ui?s=SPY&p=D&yr=0&mn=6&dy=0&id=p54368786289 with the profits and principle bought SPY on about December 7th. look at QID/QLD http://stockcharts.com/h-sc/ui?s=SDS&p=D&yr=0&mn=7&dy=0&id=p01976543687 would have sold SDS on or about Decemember 2nd then http://stockcharts.com/h-sc/ui?s=SSO&p=D&yr=0&mn=7&dy=0&id=p10853622015 with the profits and principle bought SSO on about December 10th. http://stockcharts.com/h-sc/ui?s=SSO&p=D&yr=0&mn=2&dy=0&id=p16963923131 if you want so side bar action, then buy and sell with the bottom panel as the data crosses above zero to buy and then sell as it crosses back down. It is boring, but you will make some bread. Peruse the rest at your leisure. http://stockcharts.com/h-sc/ui?s=SDS&p=D&yr=0&mn=2&dy=0&id=p02988492387 http://stockcharts.com/h-sc/ui?s=SH&p=D&yr=0&mn=2&dy=0&id=p50460165998 http://stockcharts.com/h-sc/ui?s=SPY&p=D&yr=0&mn=2&dy=0&id=p43970189215 http://stockcharts.com/h-sc/ui?s=GASL&p=D&yr=0&mn=2&dy=0&id=p24041433062 I also play these Daily on my TOS 1day1min chart 13/50 using the LBR_studies. http://stockcharts.com/h-sc/ui?s=GASX&p=D&yr=0&mn=2&dy=0&id=p66616647305 http://stockcharts.com/h-sc/ui?s=%5EESM13&p=D&yr=0&mn=7&dy=0&id=p63234100337 if you play the E-minis. 10 contracts at the present times is about $132,875.00 since it crossed over at the 1400 mark on or about December 7th. I also trade daily using the single TOS chart using the 1day 1min, 13/50 using the LBR_studies. Hope this can help Best regards, Quilln- |
| Cheese 1,374 posts msg #114049 - Ignore Cheese |
6/11/2013 10:03:40 AM I just want to say farewell and thank you to Quilln, tennisplayer2, and all the wonderful members of this excellent forum. There are many great people and great threads, but Quilln and this thread have helped me the most. I have decided to take some time out to focus, and trade only one thing well, like TRO and a few people have suggested. I have learned much from many of you and I hope I have contributed something of value along the way. I hope all is well with all of you. June 12 will be my last day. Have a great summer. Good luck to all. |
| StockFetcher Forums · General Discussion · Any swing traders here?? | << 1 ... 21 22 23 24 25 >>Post Follow-up |