| StockFetcher Forums · General Discussion · Moving averages and trends | << 1 2 3 4 >>Post Follow-up |
| Mactheriverrat 3,178 posts msg #128354 - Ignore Mactheriverrat |
5/6/2016 3:53:08 PM What moving averages do you like to use to follow trends? 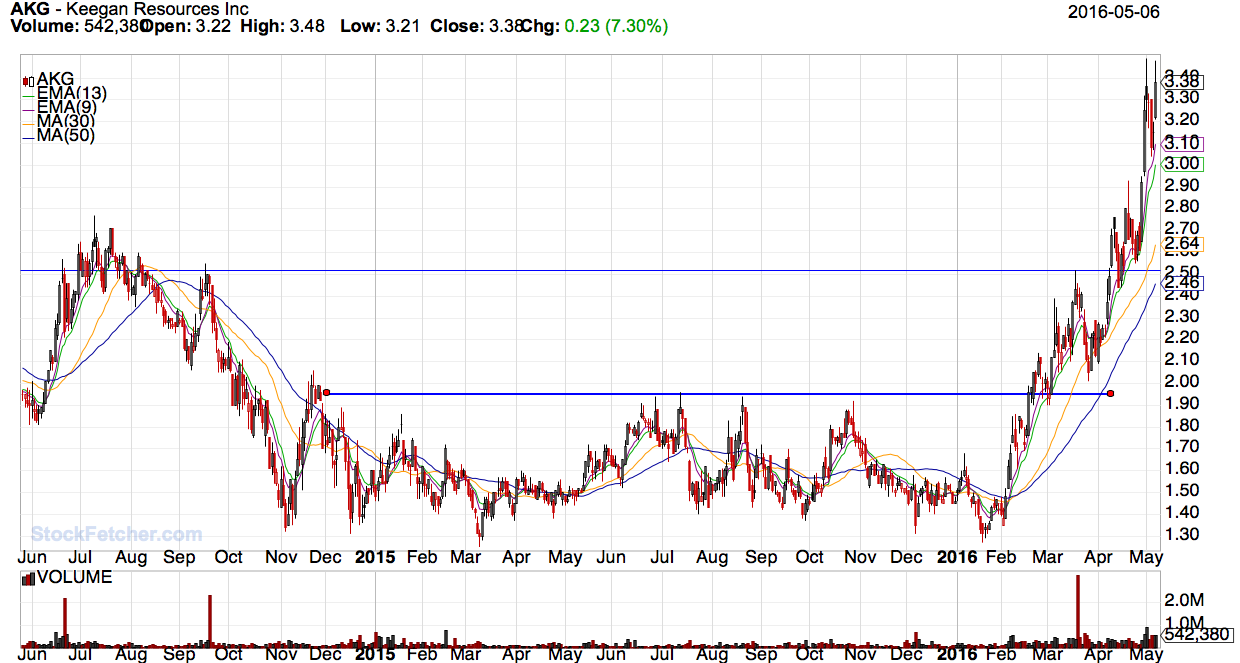 |
| pthomas215 1,251 posts msg #128357 - Ignore pthomas215 |
5/6/2016 4:27:00 PM After listening to a webinar featuring the founder of MACD, he recommended and I now follow a Weekly MACD. a weekly MACD with time frame max puts the current price in context for me. |
| Mactheriverrat 3,178 posts msg #128363 - Ignore Mactheriverrat modified |
5/6/2016 7:24:28 PM Weekly MACD you say. Hmmmm! Weekly MACD (3,10,16) histogram looks really interesting vs past runners Just the Histogram. Is very interesting vs stocks trending up as of now. Guess Just saying! |
| pthomas215 1,251 posts msg #128364 - Ignore pthomas215 |
5/6/2016 7:29:06 PM ha what the hell do I know. learning as I am going. I actually mostly look at macd dips short term and get in for the day, searching for a short spread. |
| Mactheriverrat 3,178 posts msg #128365 - Ignore Mactheriverrat modified |
5/6/2016 8:45:57 PM No pun intended! Its a interesting concept. I just to it a little farther. |
| Mactheriverrat 3,178 posts msg #128366 - Ignore Mactheriverrat modified |
5/6/2016 9:20:12 PM Submit |
| Mactheriverrat 3,178 posts msg #128372 - Ignore Mactheriverrat |
5/7/2016 11:53:21 AM Just been playing around with this drawing it on daily chart draw weekly rsi(2) line at 70 draw weekly rsi(2) line at 50 draw weekly rsi(2) line at 30 Anything above 50 Bullish Anything below 50 Bearish and EMA(9) - watching when price cross above EMA(9) MA(50) - Long term trend line. 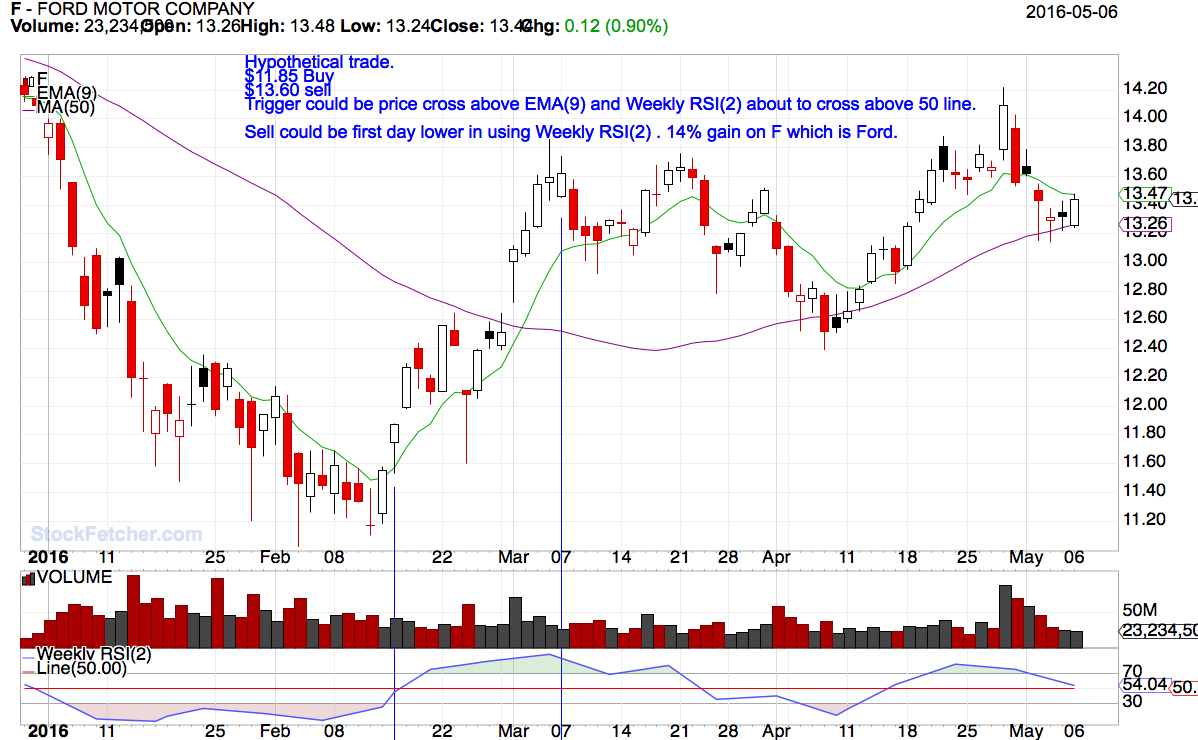 Just saying! Have a good weekend everyone. |
| four 5,087 posts msg #128375 - Ignore four |
5/7/2016 4:21:48 PM of interest? 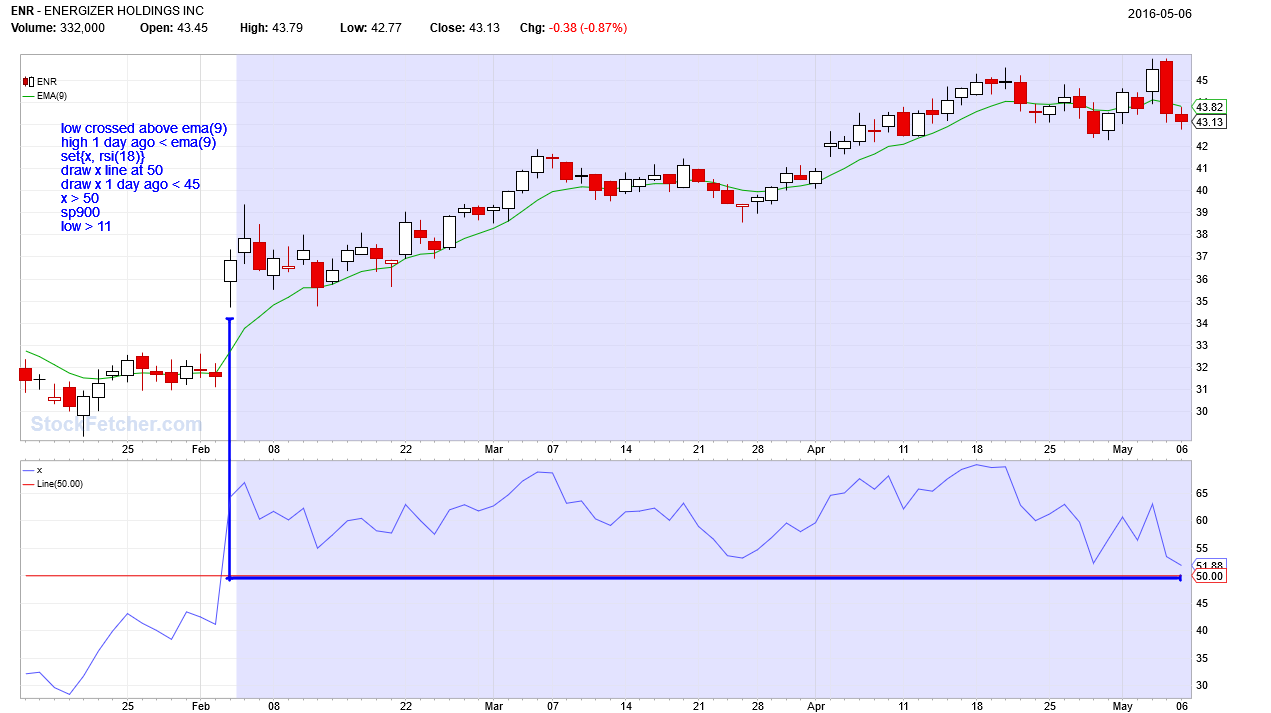 |
| ibankcoin 24 posts msg #128452 - Ignore ibankcoin |
5/14/2016 2:25:40 PM You might be interested in reading Dr. Alexander Elder's book if you haven't already done so. Dr. Elder relies totally on the weekly chart to determine long term trend and thinks a MACD divergence on the weekly chart is the most reliable indicator ever. Of course, not every divergence is good, but Dr. Elder has published information on what to look for. Good stuff. |
| Mactheriverrat 3,178 posts msg #128456 - Ignore Mactheriverrat |
5/14/2016 7:06:37 PM Interesting! |
| StockFetcher Forums · General Discussion · Moving averages and trends | << 1 2 3 4 >>Post Follow-up |