| StockFetcher Forums · General Discussion · Moving averages and trends | << 1 2 3 4 >>Post Follow-up |
| graftonian 1,089 posts msg #128460 - Ignore graftonian |
5/14/2016 11:38:04 PM Ibank: Which of Elders books are you recommending? |
| Mactheriverrat 3,178 posts msg #128461 - Ignore Mactheriverrat modified |
5/15/2016 12:10:54 AM Elders books are good. I don't know if people know this but one can down load for free books off the internet if people just put PDF after their search say a google search would be: Trading for a living Elder PDF I'm just talking about the EMA(13) and how price moves above or below it start's a new trend if it isn't a sideways movement. I know that the EMA(13) isn't going to do good on every stock. I've added the MA(20) as intermediate trend and the MA(4) as a very short term line to watch as if its moving back towards the EMA(13) to be on guard. I just using a simple filter to filer to study stocks like NVDA. One can see by filters with a Chart-time is 10 months that there are a lot of moves of different stocks. I will use ADR(30) later to narrow these filter down later maybe starting with ADR(30) above 3.00 and say 500000 shares with a Market is not OTCBB and Market is the ETF. To me its about finding and seeing the trends in its simplest form first. Then add a few indicators to see oversold area's . Maybe a RSI(4) and a RSI(18) above 50. Same here these RSI indicators act different with each stock. Looking what is the past historical tops for the RSI(4). 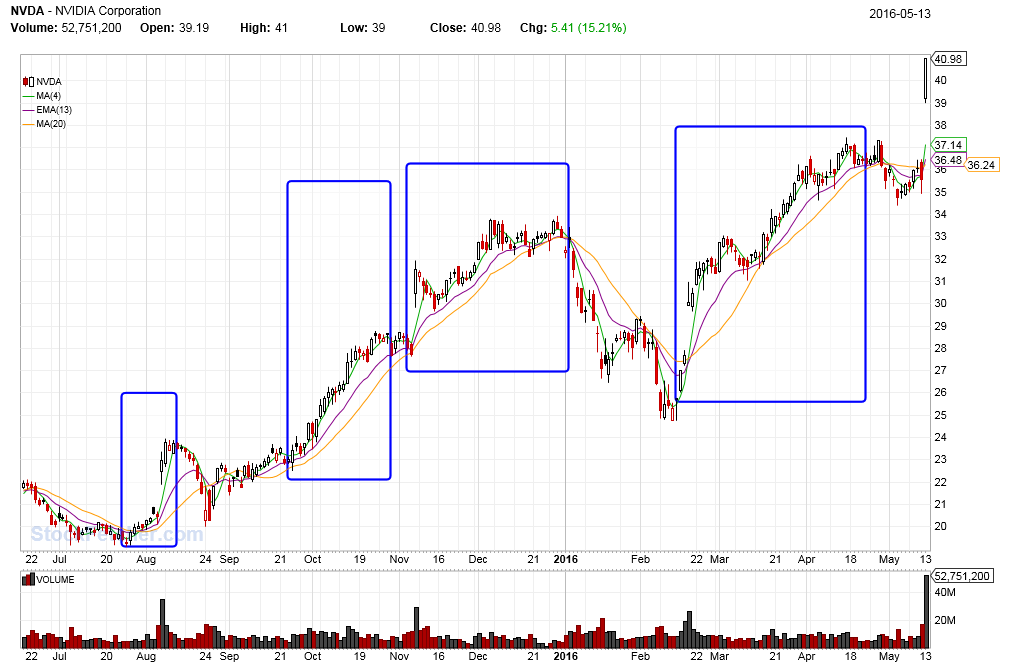 |
| graftonian 1,089 posts msg #128463 - Ignore graftonian |
5/15/2016 10:39:33 AM Mac, Thanks for the tip, you just saved vme some bucks. I guess I owe you a beer. |
| pthomas215 1,251 posts msg #128464 - Ignore pthomas215 |
5/15/2016 11:48:19 AM mac, what ibankcoin was saying earlier about weekly macd divergence was what I was referring to. I saw the same analysis on a Fidelity webinar. Do you think you can use this sort of analysis for swing trading, or just value investing? |
| Mactheriverrat 3,178 posts msg #128465 - Ignore Mactheriverrat modified |
5/15/2016 12:21:56 PM @graftonian Roger on the beer sometime. Down at the Boat club by the river in grafton. :-) @ Pthomas Yes one could use MACD in swing trading . To me the 12,26,9 is too slow IMHO but if it works for anybody then by all means use it. A popular on is the MACD 3,10,16 Here'a some code that FOUR built using a MACD 2,10, 16 without the histrogram set{macdema, cema(macd(2,10),16)} set{macdfast, macd fast line(2,10,16)} draw macdfast on plot macdema |
| four 5,087 posts msg #128466 - Ignore four modified |
5/15/2016 12:51:04 PM MAC, look at williams60 for trend rsi15 for entry (on pullback) 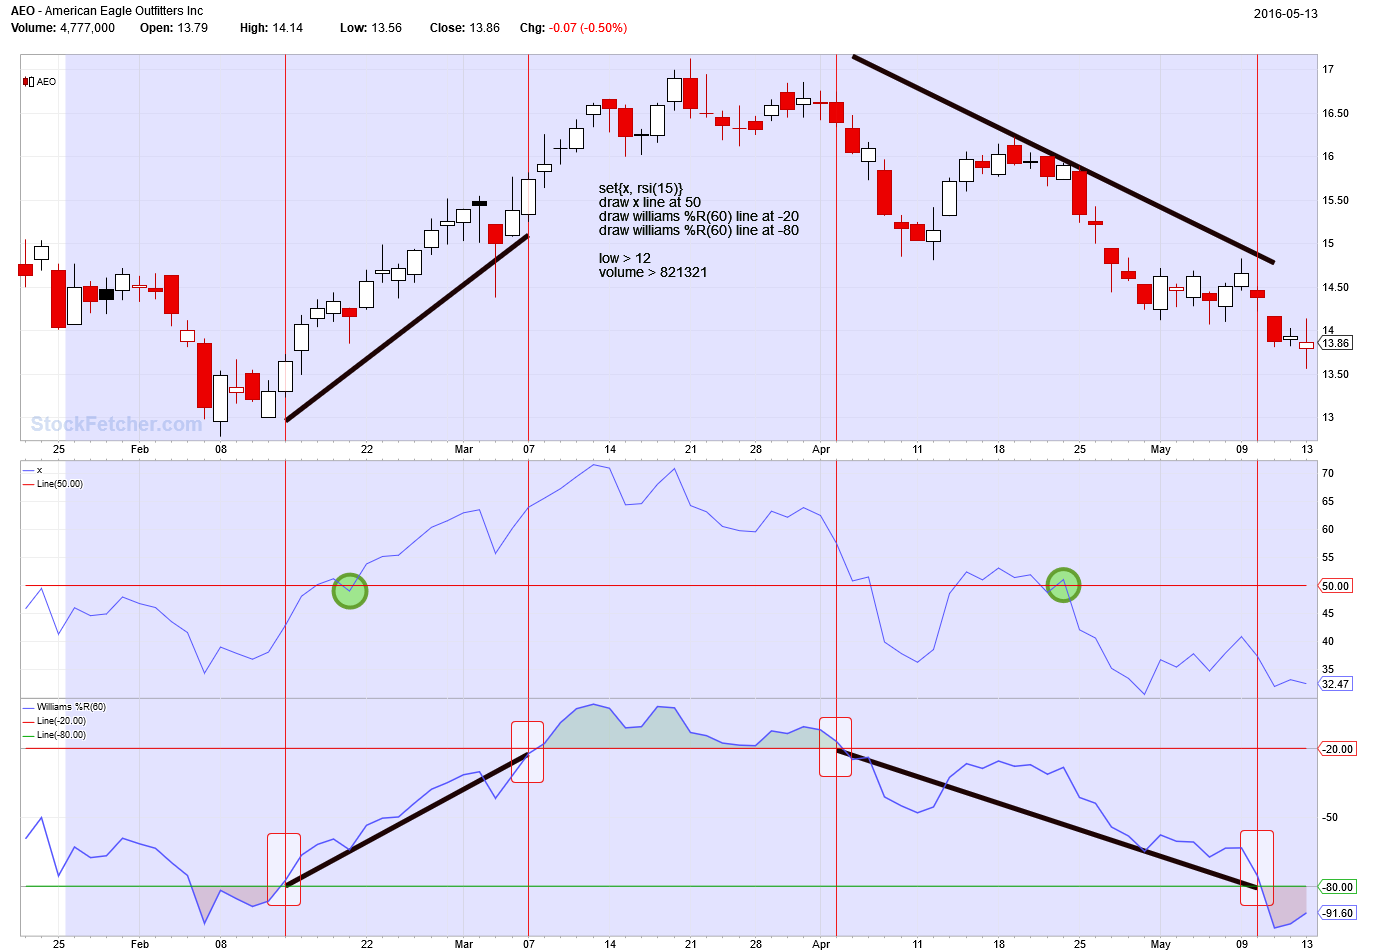 |
| graftonian 1,089 posts msg #128467 - Ignore graftonian |
5/15/2016 1:36:53 PM Just another way of looking at the problem |
| Mactheriverrat 3,178 posts msg #128468 - Ignore Mactheriverrat |
5/15/2016 1:57:00 PM Roger! To me- Price above ema(13) and RSI(9) above 50 ride the trend Wash , rinse and repeat! |
| pthomas215 1,251 posts msg #128469 - Ignore pthomas215 |
5/15/2016 4:15:39 PM Mac just to be clear, you are saying "Price above ema(13) and RSI(9) above 50" Implies a great bullish swing trade, given exponential moving average reaching new levels and strength high but not in oversold territory? Paul |
| Mactheriverrat 3,178 posts msg #128470 - Ignore Mactheriverrat |
5/15/2016 7:41:08 PM Yes - Price crossed above EMA(13) and the RSI(9) crossed above 50 . To me is Bullish |
| StockFetcher Forums · General Discussion · Moving averages and trends | << 1 2 3 4 >>Post Follow-up |