| StockFetcher Forums · Stock Picks and Trading · SPY Channel | << 1 2 >>Post Follow-up |
| xarlor 614 posts msg #158274 - Ignore xarlor |
12/29/2021 11:22:35 AM For any channel traders out there, looks like we have a new market channel. The previous channel's bottom is now the new channel's top. The new channel has a 3x4 confirmation (3 upper bounces and 4 lower bounces) so it's fairly strong. 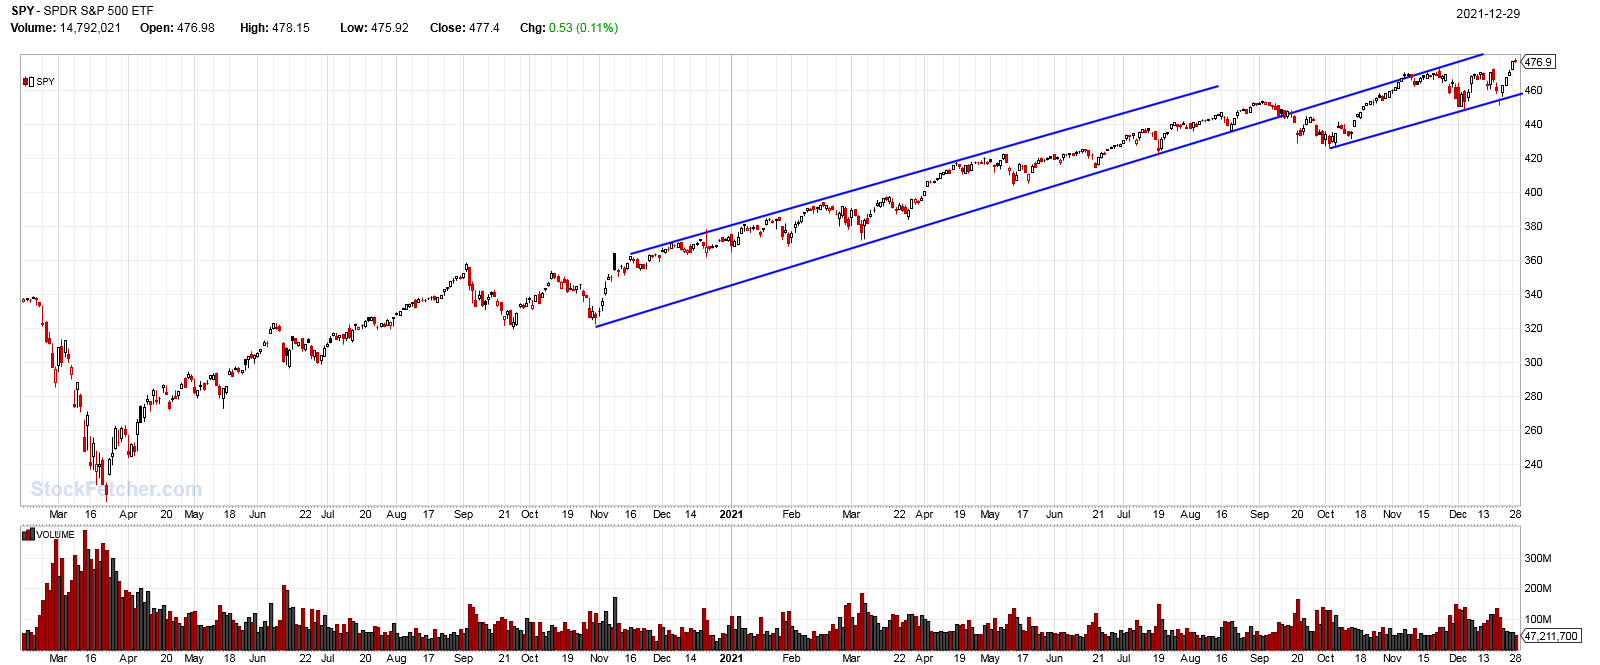 |
| Cheese 1,374 posts msg #158276 - Ignore Cheese |
12/29/2021 12:37:25 PM https://www.stockfetcher.com/forums/Stock-Picks/SPY-Channel/158274 xarlor 12/29/2021 11:22:35 AM For any channel traders out there, looks like we have a new market channel. The previous channel's bottom is now the new channel's top. The new channel has a 3x4 confirmation (3 upper bounces and 4 lower bounces) so it's fairly strong. ==================== Thank you, xarlor. I am not familiar with trading channel but your post looks interesting. 1. is Investopedia a good place to start reading up on trading channel ? 2. Do you have a filter for beginners to scan and draw channel? This is all I got at this point |
| xarlor 614 posts msg #158278 - Ignore xarlor |
12/29/2021 1:48:54 PM Investopedia is ALWAYS a good place to start on anything. Additionally, this site does a good job explaining channels. The following lesson expands on how to trade it using support/resistance. After all, channels are just support and resistance lines. The site is for learning Forex, but most of it applies to stocks as well. Personally, I like to pair the channels with other indicators. Remember, the more indicators match up, the higher probability trade it is. I find RSI(5) a good pairing for SPY and other slow-moving tickers.
The above applies to bullish channels. Up to now, I didn't have any filters that find channels (check the second filter below for one). Usually you trade channels on tickers you're very familiar with and can reasonably expect the channel to be respected. However, Linear Regression(60) does a fairly decent job of drawing the channel for you on SF! :D Here's a filter I threw together as I wrote this post. No testing has gone into this, so caveat emptor. |
| Cheese 1,374 posts msg #158279 - Ignore Cheese |
12/29/2021 2:24:12 PM https://www.stockfetcher.com/forums/Stock-Picks/SPY-Channel/158274 xarlor 12/29/2021 1:48:54 PM Personally, I like to pair the channels with other indicators. Remember, the more indicators match up, the higher probability trade it is. I find RSI(5) a good pairing for SPY and other slow-moving tickers. If LOW is near the bottom support line and RSI(5) is or has been below 30 recently, it's a good entry. If HIGH is near the top resistance line and RSI(5) is or has been above 80 recently, it's a good exit. Usually you trade channels on tickers you're very familiar with and can reasonably expect the channel to be respected. However, Linear Regression(60) does a fairly decent job of drawing the channel for you on SF! :D THANK YOU very much, xarlor. You are a real expert ! |
| snappyfrog 749 posts msg #158281 - Ignore snappyfrog |
12/30/2021 7:06:28 AM I know this is about SPY, but I have been trading IWM (Russell 2K) for the last 6 months. Even though it broke out of the channel near Nov 1st, we are right back into it again. 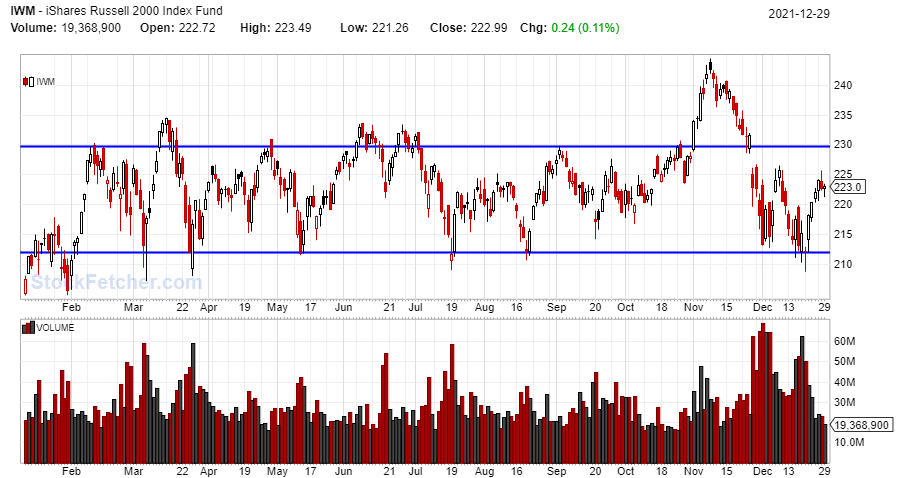 |
| xarlor 614 posts msg #158283 - Ignore xarlor |
12/30/2021 8:06:07 AM Good call snappyfrog! Here is IWM with RSI(5) confirmation on the channel borders. Matches up pretty good and is textbook channel trading goodness. 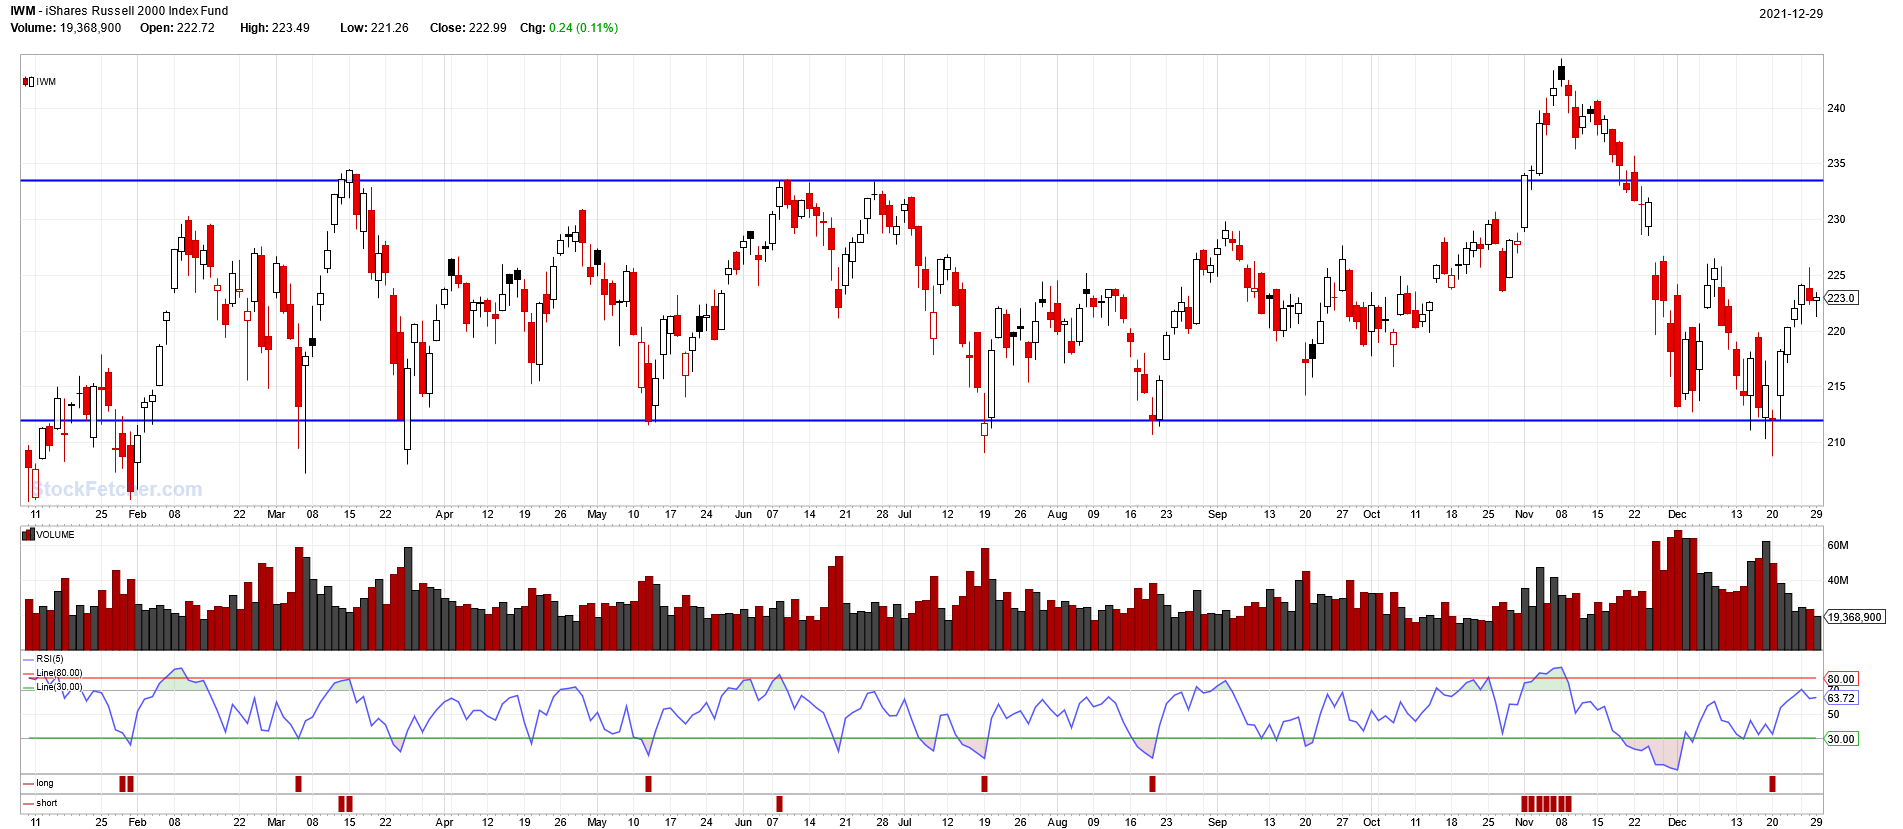 |
| Cheese 1,374 posts msg #158284 - Ignore Cheese |
12/30/2021 12:33:33 PM /* https://www.stockfetcher.com/forums/Stock-Picks/SPY-Channel/158274 ============================== */ snappyfrog and xarlor, A BIG THANK YOU to BOTH OF YOU I hope you don't mind my combined filter posted below. It has helped me with my Channel Trading learning. Perhaps, it may help other beginners. |
| redversa721 157 posts msg #158288 - Ignore redversa721 |
12/30/2021 7:16:18 PM hi guys, Pretty cool stuff. Thanks for some new education. Xarlor. On your screener. what is the number 212 and 233. are those the channel top and bottom? is that something you set or can that be derived based on the timeframe Thanks in advance. That chart with the RSI looks beautiful. I have to look into this. Seems to be a 'algorithmic' way of trading and seems less risky |
| xarlor 614 posts msg #158289 - Ignore xarlor |
12/30/2021 8:30:47 PM I just put those values in based on the IWM's channel top and bottom. They are hard coded for IWM. As I said, usually you trade channels on tickers you are intimate with. So once you identify such a ticker and channel, you can hard-code a filter to stay on it. I'm sure you could write a filter to identify the tops and bottoms, but you run the risk of the filter not working when it breaks our of the channel significantly as IWM did. |
| snappyfrog 749 posts msg #158290 - Ignore snappyfrog |
12/30/2021 9:18:07 PM Thanks xarlor and cheese! |
| StockFetcher Forums · Stock Picks and Trading · SPY Channel | << 1 2 >>Post Follow-up |