| StockFetcher Forums · Filter Exchange · Weekly and Daily MACD on Same Graph | << 1 2 >>Post Follow-up |
| snappyfrog 753 posts msg #154365 - Ignore snappyfrog |
10/19/2020 8:29:31 AM I have been using an oscillator from ToS in my trading there and requested help setting it up here. This was in "General Discussion" Forum. I thought I would move the scan(s) here for others to find easier. xarlor was kind enough to work this out and it matches exactly what I was looking for to use here in SF. |
| snappyfrog 753 posts msg #154366 - Ignore snappyfrog |
10/19/2020 8:36:55 AM The purpose of this oscillator is that once in a trade, the Daily MACD will give quicker signals, sometimes getting you out of a trade on a small pullback. The Weekly MACD will be saying to stay in the trade. Putting both one one plot really helps me to let my winners run. In the process, I have also morphed this into trying to use the Daily MACD coming off of the 22 day low of the Daily MACD as a signal to buy (or be ready to buy). This is much like I use the PVI indicator. Thanks again to xarlor. |
| snappyfrog 753 posts msg #154367 - Ignore snappyfrog |
10/19/2020 8:43:41 AM Example of when the Daily MACD coming off of the 22 day low would have picked PLUG. Note the 1st oscillator for the Weekly and Daily would have kept you in the trade since June while the Daily gets you in and out, hence more buy signals.  |
| Cheese 1,374 posts msg #154373 - Ignore Cheese |
10/19/2020 10:17:23 AM Excellent. Thank you, snappy and xarlor |
| xarlor 646 posts msg #154377 - Ignore xarlor |
10/19/2020 2:47:41 PM Thanks for sharing how you put this indicator to use, snappyfrog. I understand your entry points and they do look quite enticing. You mentioned you use this indictator to let your winners run. What is your exit signal? Weekly_and_Daily_MACD crossing below Weekly_MACD or zero? Profit target? Something else? Good stuff! |
| snappyfrog 753 posts msg #154385 - Ignore snappyfrog modified |
10/20/2020 6:50:17 AM Depending on the strength of the individual stock movement, my exit is the EMA(30) or a trailing stop-loss of 5%. |
| nibor100 1,103 posts msg #154400 - Ignore nibor100 |
10/21/2020 1:16:43 PM @ snappyfrog, I've been looking over your PLUG example of staying in the trade in conjunction with the possible exit criteria you replied to Xarlor and they don't seem to reconcile very well. It appears several times in the past 4 months or so PLUG has declined by more than 20%, while still being in the trade based on the new indicators; but you would have been out based on those 2 exit criteria. An example is below showing a max drawdown of around 29%. Ed S. |
| snappyfrog 753 posts msg #154401 - Ignore snappyfrog |
10/21/2020 7:53:30 PM Nibor100, you are correct. The EMA(30) or the 5% trailing stop-loss normally gets me out of swing trades. I am terrible at long term investing. This is what I plan to use the WeeklyandDailyMACD for is to try to condition my mind to hold longer and not worry about the dips. I can see the possibility of adding to trades on the daily MACD dips as long as the weekly MACD says stay in the trade. I also buy LEAPS on options and I get out way too soon. Example is I bought SQ in late April for $234 and sold a couple months latter at $989. Great trade eh? Two weeks later I could have sold for over $4800. These are the problems I am trying to avoid. |
| snappyfrog 753 posts msg #154513 - Ignore snappyfrog |
10/31/2020 1:33:01 PM Here is an example of when the EMA(13) would have taken me out of a trade on IQ while the Weekly MACD says to stay in the trade (two boxes) and when I should get out (circle). 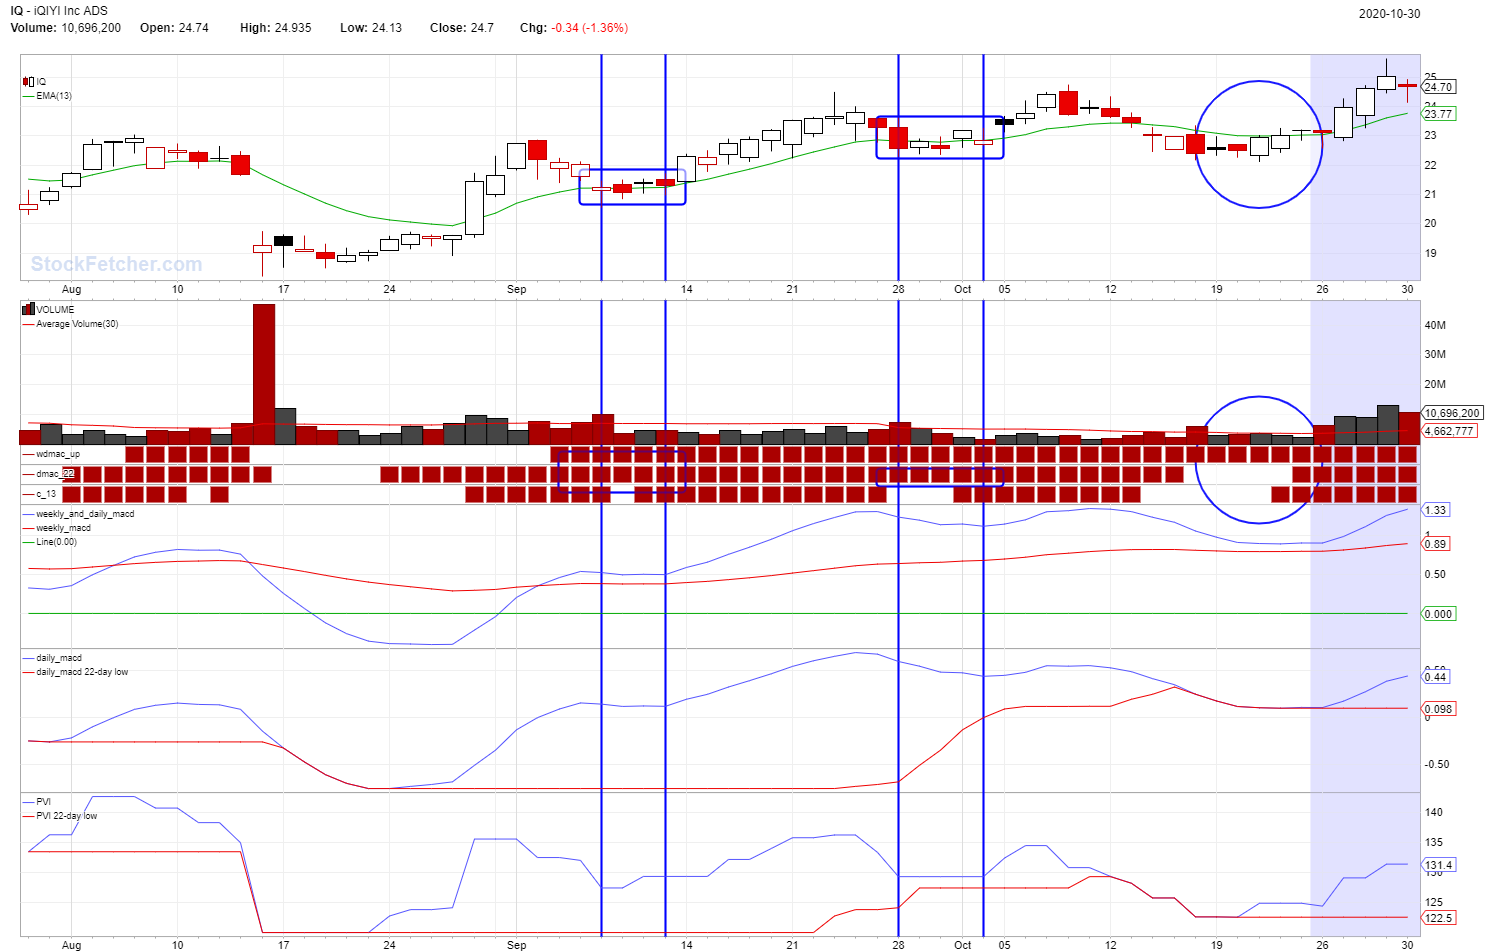 |
| Cheese 1,374 posts msg #154514 - Ignore Cheese |
10/31/2020 2:29:45 PM Thank you, snappy. I like your filter and I would like to make sure that I'd use it to the full potential that you intended. I used your filter to look at the TCON example mentioned in another thread, and it seems to me that your "draw Weekly_MACD on plot Weekly_and_Daily_MACD" would have kept TCON buyers out of trouble when TCON was not a good buy, while capturing all three opportunities for gains in the past two years. But for instruments like SPY, which has a built-in long-term upward bias, we could divide our alloted capital into three tranches, one for each signal from your bottom three line charts. How do you use your filter? |
| StockFetcher Forums · Filter Exchange · Weekly and Daily MACD on Same Graph | << 1 2 >>Post Follow-up |